
Fig. 3.
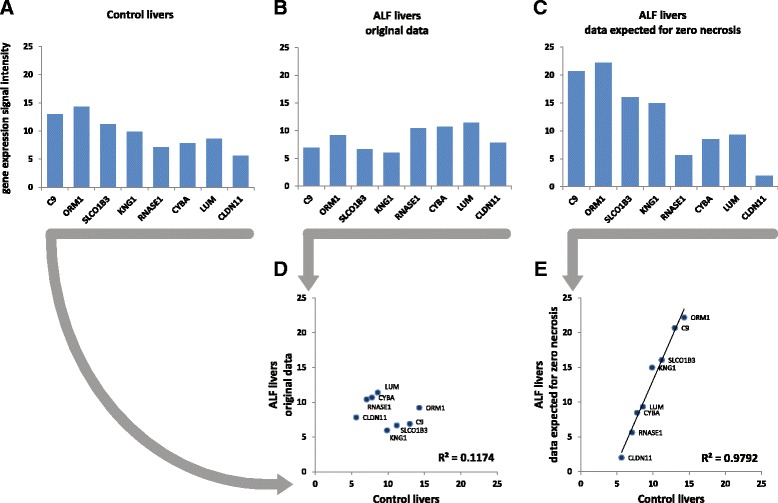
Gene expression corrected for necrosis. Data refer to the same mRNAs shown in Fig. 2. a control livers. b ALF livers. c ALF livers data expected for zero necrosis, obtained as the intercept of the regression between necrosis (X variable) and gene expression (Y variable). d correlation between control livers and original ALF livers data. e correlation between control livers and ALF livers data expected for zero necrosis