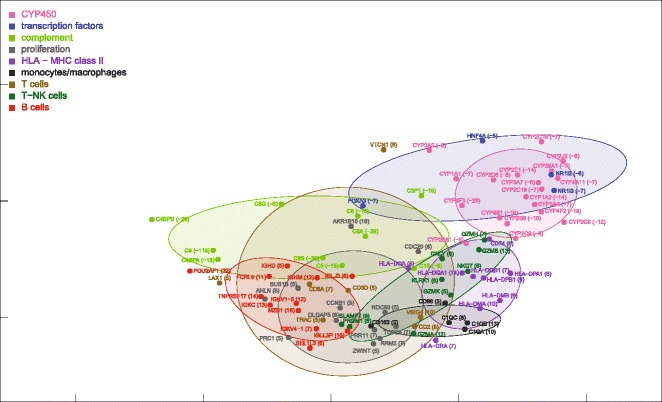
Fig. 9.

MDS mapping of mRNAs expressed in control livers. This figure is to be compared with Fig. 4. A 360° rotation of 3D ellipses is shown in the Additional file 3: Movie 2. The nine ellipses are also shown in next Figs. 10, 11, 12 and 13 for reference. The numbers in parentheses, on the right of gene symbols, are the fold changes
