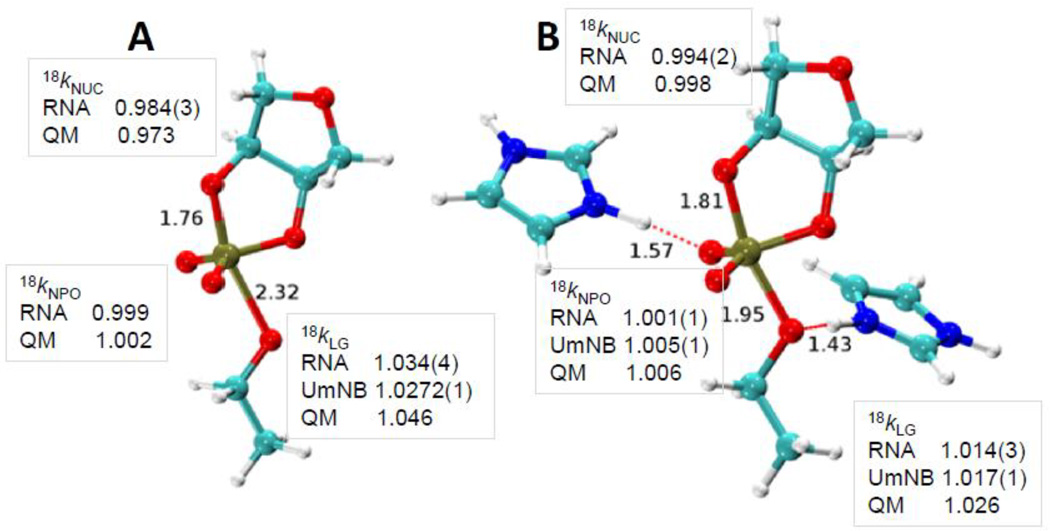
Fig. 4.
Transition state structures for nonenzymatic specific base catalysis (A) and for the enzymatic transition state model based on hydrogen bonding in the active site of the RNase A (B). The 2’O-P and 5’O-P bond lengths are indicated. For the RNase A transition state model the hydrogen bonds involving His119 and the 5’O, and His12 and a non-bridging oxygen are also indicated. The observed and calculated KIEs for the 2’O nucleophile (18kNUC), 5’O leaving group (18kLG) and non-bridging phosphoryl oxygens (18kNPO) are shown adjacent to the corresponding atoms in the transition state models. KIE values obtained for RNA and for uridine-m-nitrobenzyphosphate (UmNB) are labeled accordingly. Note that the computational results were obtained using a simplified ribose 3’-ethylphosphate model.

