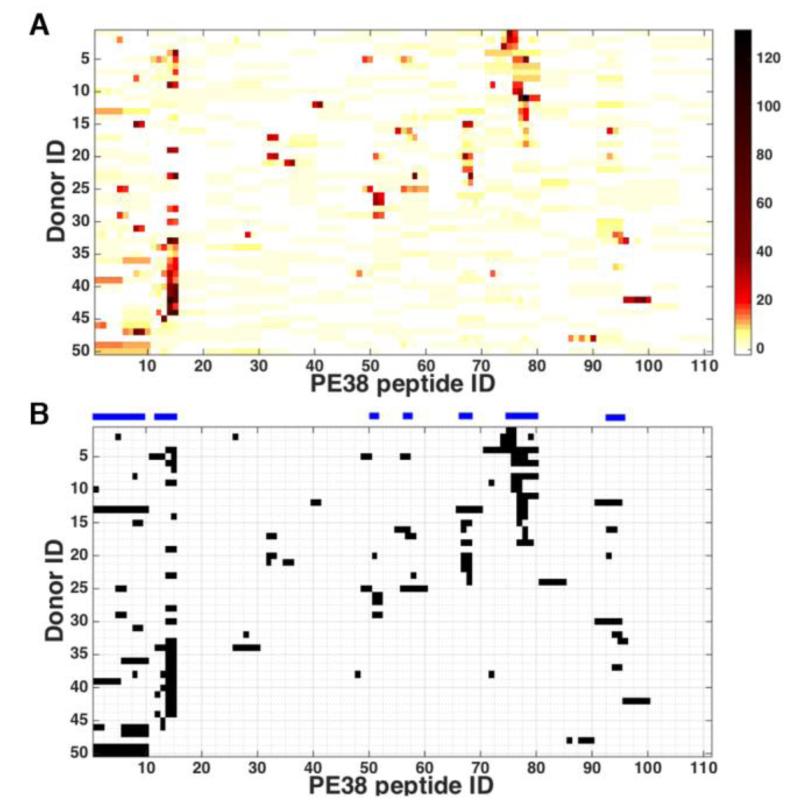
Figure 1.
Normalized donor response. Each normalized response represents a normalized average of two assays, each was run in quadruplicates for 50 PBMC samples (A) the Z-scores of the ELISpot counts of each donor for each peptide. The darker the color, the higher the Z-score. (B) Binarized Z-scores using cut off value of 6.0. The horizontal bars above the chart indicate epitope regions where four or more donors responded.

