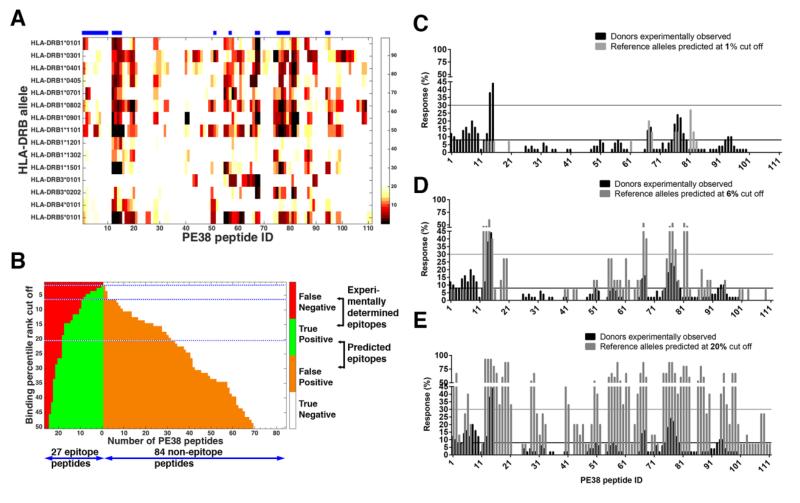
Figure 5.
The percentile ranks predicted by IEDB “recommended” method for the 15 reference HLA-DRB alleles and the performance evaluated using the 15 reference HLA-DRB alleles. (A) Percentile ranks more than 20% were considered non-binders and colored in white; those below 20% are colored in black for the strongest binder and in beige for the weakest. The horizontal bars above the chart indicate epitope regions where four or more donors responded experimentally. Peptide ID is indicated on the X-axis. (B) The number of TP, FP, TN and FN frequent epitopes predicted at different percentile rank binding cutoff values. A peptide was predicted as a frequent epitope if it is predicted to cause 5 or more alleles to respond. The dotted blue lines indicate the binding cutoff at 1%, 6% and 20% ranks. (C, D, E) The fraction of responding donors according to the normalized experimental Z-scores (black bars, n=50) and as predicted by the IEDB “recommended” method (gray bars) using for the 15 reference HLA-DRB alleles at binding percentile rank cutoff values of 1% (B), 6% (C), and 20% (D). The horizontal lines are the thresholds for a peptide to be considered frequent epitope black for experimental epitopes (4/50=8%) and the gray for predicted (5/15=30%).

