
Figure 3.
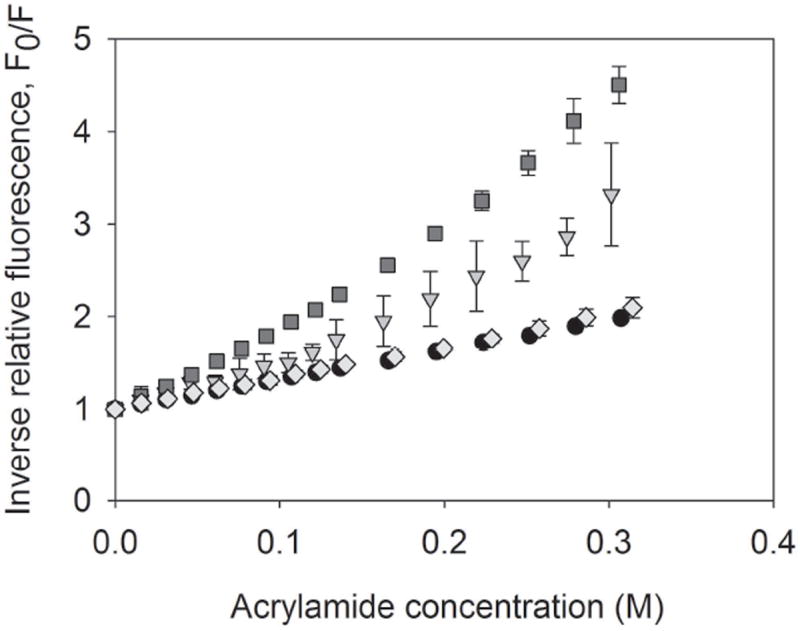
Stern-Volmer plots of inverse relative fluorescence vs. acrylamide concentration for native OVA (circles), OVA adsorbed to silicone oil microdroplets (triangles), OVA adsorbed to Alum (diamonds), and OVA unfolded in 8 M Urea 25 mM DTT (squares). Stern-Volmer constants were obtained from the slope of the initial linear portion of the plot. Error bars represent the standard deviation from the average of three replicates.