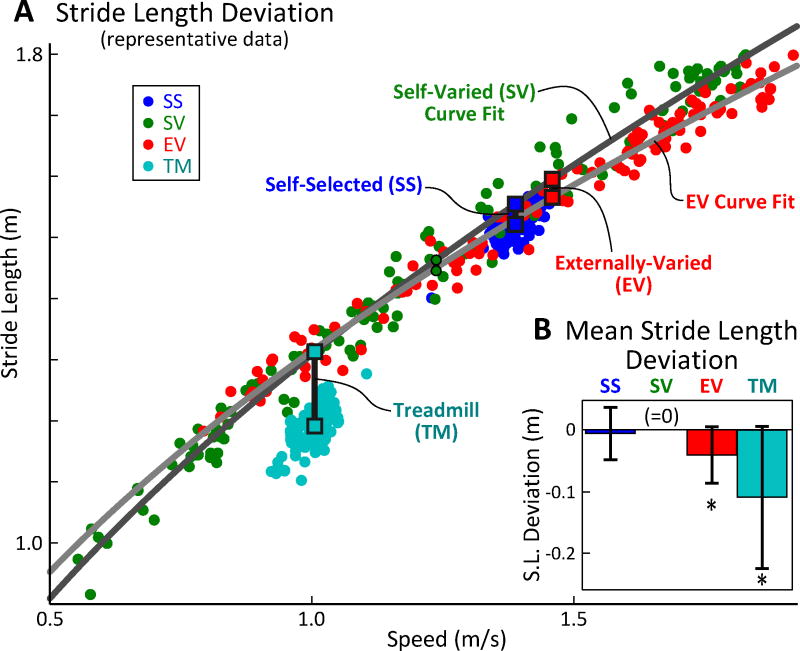
Figure 4.
(A) Representative data for stride length, plotted against stride speed. Stride length vs stride speed variations follow the expected shape when speed is varied (SV and EV). (B) However, externally-varied (EV) and treadmill (TM) conditions exhibit mean stride lengths that are shorter than predicted from the more natural SV condition. * Statistically different from zero, P < 0.001.

