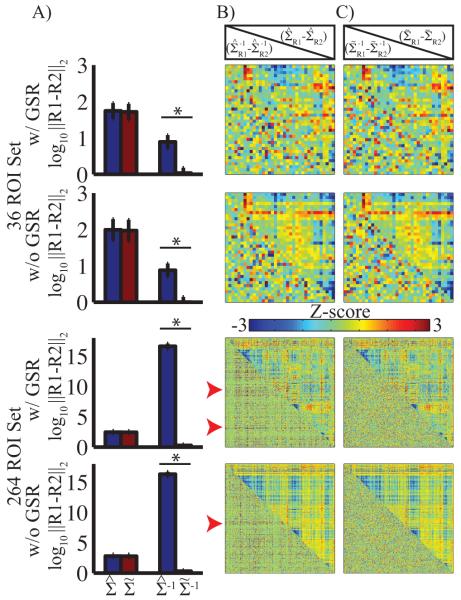
Figure 2. Matrix conditioning is sufficient to constrain the covariance inverse.
A: Mean Euclidean distance between covariance and inverse covariance matrices calculated from the first and second fMRI sessions. Blue bars display results without conditioning; red bars display results with conditioning. Error bars represent standard deviation across subjects. Asterisks indicate significant differences; in this case p < 0.001. Conditioning had no significant effect on distance for full covariance results, but significantly reduced the distance (error) between the inverse covariance matrices. B: Z-transformed (removal of mean and normalization by standard deviation) mean difference between the first and second sessions without conditioning. Full covariance results are above the diagonal; partial covariance results are below the diagonal. Red arrow heads indicate organized pattern of large values in the inverse matrix. C: Same as B, but with conditioning. Structured noise is absent in the conditioned result.

