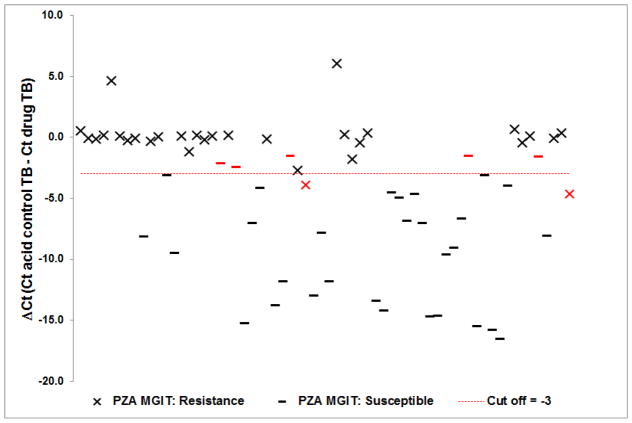
Figure 1.
Correlation between MGIT pyrazinamide susceptibility results and D29 phage qPCR. Results of 64 M. tuberculosis isolates show the ΔCt (Ct of acid control TB - Ct of drug TB) where a value < −3.0 is defined as susceptible, and a value ≥ −3.0 is defined as resistant. Red -, x are discrepancies between D29 phage qPCR and standard MGIT results.

