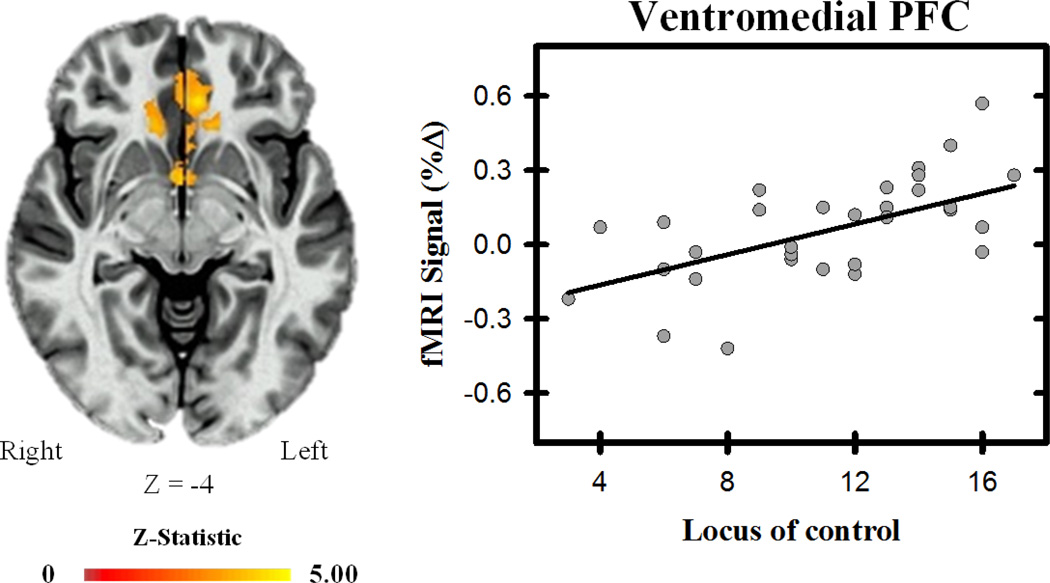
Figure 4.
Ventromedial PFC and locus of control. The differential unconditioned fMRI signal response within the vmPFC varied with participants’ locus of control, such that as locus of control became more external, the differential response (i.e., UCS alone minus CS+UCS) increased. Graph depicts the relationship between fMRI signal (% change) and locus of control scores.

