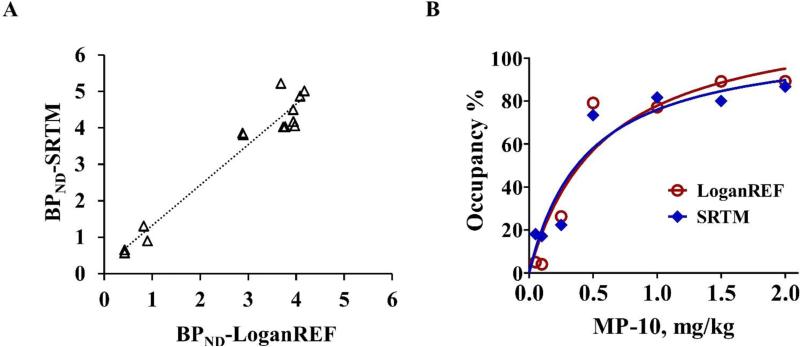
Figure 7.
MP-10 dose and PDE10A occupancy relationship. A. Scatter plot of BPND in the striatum with SRTM versus BPND LoganREF modeling showed good correlation. B. Target occupancy curves using LoganREF (red) and SRTM (blue) respectively. The fitted ED50 is 0.31 ± 0.09 mg/kg (LoganREF) and 0.45 ± 0.17 mg/kg (SRTM).

