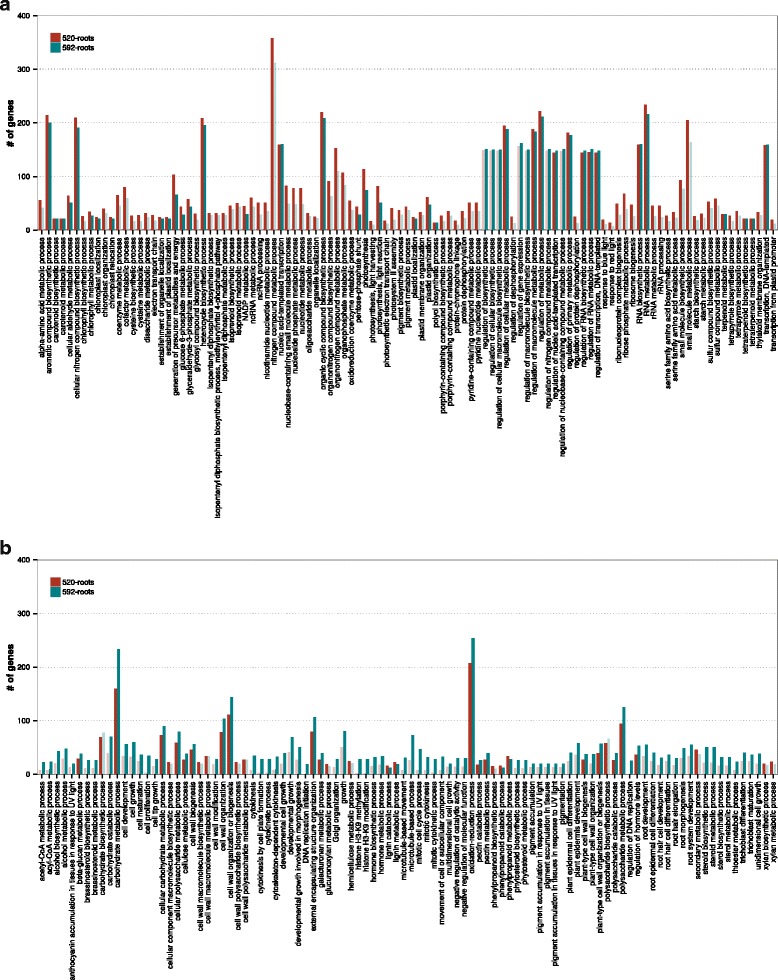
Fig. 3.

Over-represented GO terms at the biological process ontology level for up- (a) and downregulated (b) DEGs in the root tips of genotype 592 and genotype 520. The red bars show the number of DEGs annotated with the GO terms in the root tips of genotype 592 and the blue bars show the number of DEGs annotated with the GO terms in the root tips of genotype 520. GO terms are presented if they were enriched (FDR < 1 × 10⁻⁴) in at least one of the two genotypes and if at least ten genes were enriched for that term. Solid bars represent a significant over-representation of the GO term in this genotype while fainted bars are given as reference if the significance level was not reached
