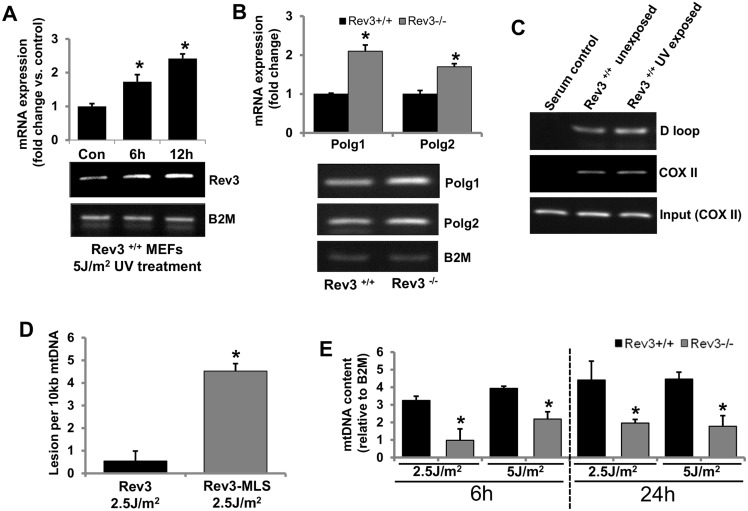
Fig 4. REV3 protects cells from mtDNA damage.
(A) RT PCR results showing a time-dependent increase in Rev3 gene expression in Rev3+/+ cells after UV exposure. The bar graph represents fold change in mRNA expression (mean ± s.d.) from at least three independent experiments. *P<0.05 versus UV-unexposed control; Student's t-test. (B) RT PCR analysis showing increased expression of Polg1 and Polg2 in Rev3-/- cells relative to Rev3+/+ cells. The bar graph represents fold change in mRNA expression (mean ± s.d.) from at least three independent experiments. *P<0.05 versus Rev3+/+; Student's t-test. (C) Representative ChIP results showing binding of REV3 to the mtDNA (D loop and COX II region) in Rev3+/+ cells. Experiment was carried out in triplicate. A further increase in REV3 binding to the D loop region is evident after UV exposure. (D) mtDNA damage analysis in UV-exposed (2.5 J/m2) HEK293 cells expressing full-length Rev3 and HEK293 cells expressing Rev3 without the MLS (Rev3-MLS) after 6 h of exposure. Bars represent the mean ± s.d. *P<0.05 versus full-length Rev3 expressing cells; Student's t-test. (E) mtDNA content of UV-exposed (2.5 and 5 J/m2) Rev3+/+ and Rev3-/- cells after 6 and 24 h of exposure. Bars represent the mean ± s.d. *P<0.05 versus respective UV-unexposed cells; Student's t-test.

