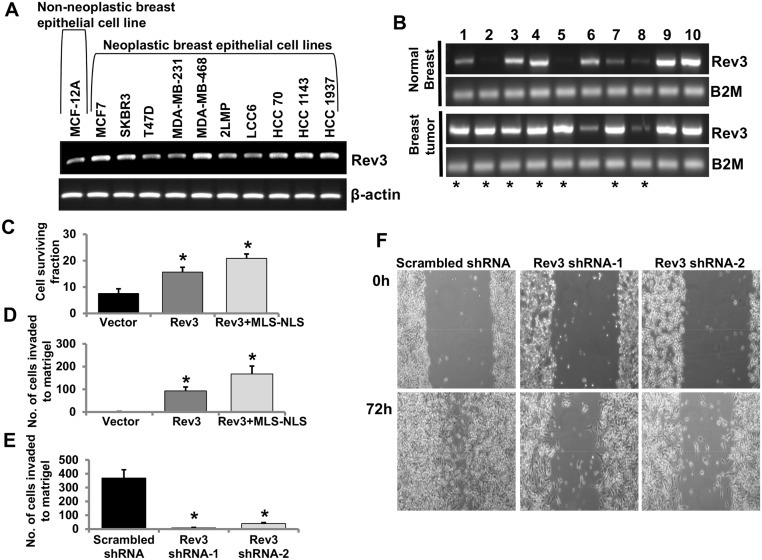
Fig 5. Mitochondrial REV3 contributes to tumorigenic properties.
(A-B) RT PCR analysis of Rev3 gene expression in the non-neoplastic breast epithelial cell line MCF-12A and in 10 neoplastic breast epithelial cell lines (A), and in a set of 10 primary breast tumors and matched normal breast tissues from the same patients (B). Breast tumor samples showing increased mRNA expression of Rev3 compared to respective matched normal breast tissue are denoted by asterisks (*) (B). (C-D) Levels of survival (C) and Matrigel invasion capacity (D) of full-length Rev3 and Rev3+MLS-NLS expressing HEK293 cells. Bars represent mean ± s.d. *P<0.05 versus vector-transfected cells; Student's t-test. (E) Matrigel invasion capacity of Rev3 shRNA-transfected HeLa cells (Rev3 shRNA-1 and Rev3 shRNA-2). Bars represent the mean ± s.d. *P<0.05 versus scrambled shRNA-transfected HeLa cells; Student's t-test. (F) Comparison of cell-culture migration capacity of Rev3 shRNA-transfected HeLa cells (Rev3 shRNA-1 and Rev3 shRNA-2) with scrambled shRNA-transfected HeLa cells.

