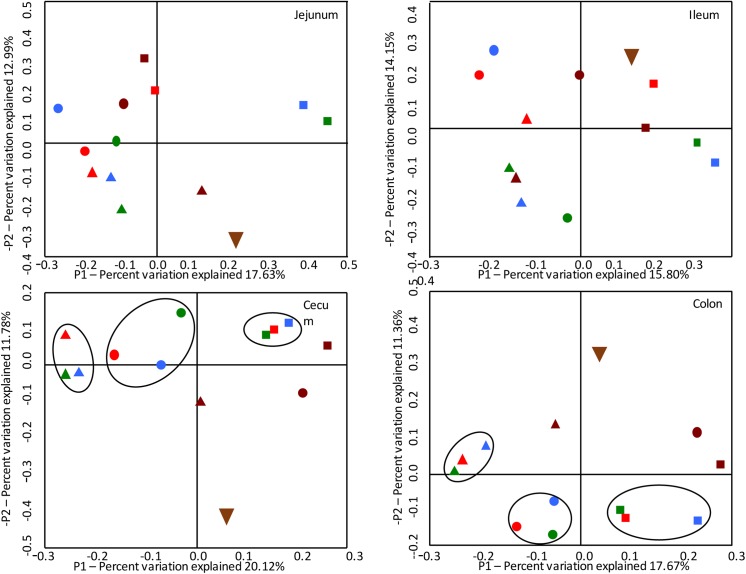
Fig 3. Principal coordinate analysis graphs comparing the total compositions of the microbiomes in four pig tissues (jejunum, ileum, cecum, and colon) at various times.
The symbol shape associated with each data point represents the time of sample collection (5 (upside down triangle), 7 (triangles), 9 (circles), and 11 (squares) weeks of age). The symbol color reflects the treatment: maroon = non-challenged controls, red = challenged with S. enterica serovar Typhimurium strain 798, green = Lawsonia intracellularis strain PHE/MN1-00, blue = both challenge pathogens.

