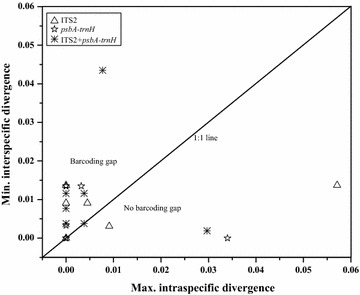
Fig. 3.

Barcoding gap between Hippophae species based on intra- and inter-specific distances. Minimum inter-specific K2P distance vs. maximum intra-specific K2P distance for ITS2, psbA-trnH, and ITS2 + psbA-trnH. Each data point represents a species, and each species located above the 1:1 line has a barcoding gap
