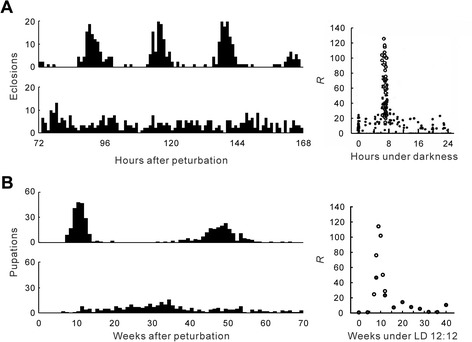
Figure 2.

Induction of arrhythmicity by a specific stimulus in circadian and circannual clocks. (A) Circadian eclosion rhythm in Drosophila pseudoobscura. Arrhythmicity was induced with a blue-light pulse at an intensity of 0.1 W/m2 near conditions of a pulse length of 50 s and of a time of pulse onset of 6.8 h after transfer to constant darkness (lower left), whereas without pulses, circadian rhythmicity was shown in constant darkness (upper left) [42]. The right panel shows the arrhythmicity induced by a blue-light pulse (0–120 s). R values were calculated from hourly emergence counts in three or four circadian cycles and are plotted as a function of the time of pulse onset. The larger circles represent the experiments using stimuli particularly close to conditions of a pulse length of 50 s and of a time of pulse onset of 6.8 h after transfer to constant darkness (reproduced from [42] with kind permission from Elsevier). (B) Circannual pupation rhythm in Anthrenus verbasci. Arrhythmicity was induced with a 4-week long-day pulse of LD 16:8 applied nine weeks after exposing larvae to LD 12:12 (lower left), whereas without pulses, circannual rhythmicity was shown with a period of approximately 40 weeks under constant short-day conditions of LD 12:12 (upper left) (reproduced from [47] with kind permission from Springer Science+Business Media). The right panel shows the arrhythmicity induced by a 4-week long-day pulse. R values were calculated from weekly pupal counts in one or two circannual cycles (closed circles [46]), or three circannual cycles (open circles [47]) and are plotted as a function of the time of pulse onset. Statistically complete arrhythmicity is shown by R values approaching approximately 150 [42]. In practice, R values of 30 or less are considered highly rhythmic and those greater than 90 arrhythmic [2,42,47].
