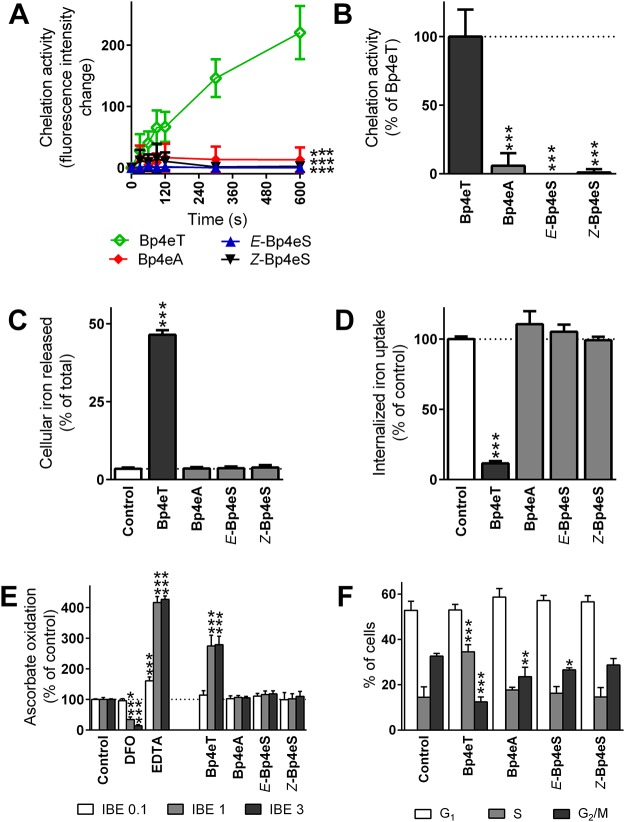
Fig 3. The ability of Bp4eA and Bp4eS to bind iron, to form redox active iron complexes and to cause an increase in the S phase and a decrease of G2/M phase of cell cycle was negligible compared to the parent chelator, Bp4eT.
The efficacy of Bp4eT or its metabolites to chelate iron from the LIP of MCF-7 cells was measured using the calcein-AM assay. (A) Fluorescence of free calcein after the addition of 10 μM Bp4eT or its metabolites for 10 min/37°C. (B) Intensity of fluorescence of free calcein in the presence of the metabolites at t = 600 s was expressed as a percentage of the fluorescence of free calcein in the presence of Bp4eT. The results of (A) and (B) are mean ± SD (n = 6 experiments). Statistical significance (ANOVA): *** p < 0.001 as compared to Bp4eT. (C) Efflux of 59Fe mediated by control medium or medium containing the agents (25 μM) after a 3 h/37°C incubation of MCF-7 cells prelabeled with 59Fe-transferrin. (D) Uptake of 59Fe from 59Fe2-transferrin by MCF-7 cells in the presence of control medium or medium containing the agents (25 μM) were determined after a 3 h/37°C incubation. The results of (C) and (D) are mean ± SD (n ≥ 3 experiments). Statistical significance (ANOVA): *** p < 0.001 as compared to the control (untreated) group. (E) The ascorbate oxidation assay was used to examine the formation of redox active complexes. Bp4eT and its metabolites were assayed at iron binding equivalents (IBE) of 0.1 (excess of iron to chelator); 1 (fully complete coordination shell); and 3 (excess of chelator to iron). The chelators, DFO and EDTA, were used as anti-oxidative or pro-oxidative controls, respectively. Data are expressed as a percentage of the control group without chelator at the same IBE (100%). The results of (E) are mean ± SD (n ≥ 3) experiments. Statistical significance (ANOVA): *** p < 0.001 as compared to the control group (iron with ascorbate) in the same IBE. (F) MCF-7 cells were incubated for 72 h/37°C with 100 nM of Bp4eT or its metabolites, Bp4eA and Bp4eS. Cell cycle analysis was processed by flow cytometry using propidium iodide. Phase quantification was evaluated using MultiCycle AV Software. The results of (F) are mean ± SD (n ≥ 3 experiments). Statistical significance (ANOVA): * p < 0.05, ** p < 0.01, *** p < 0.001 as compared to the control group.

