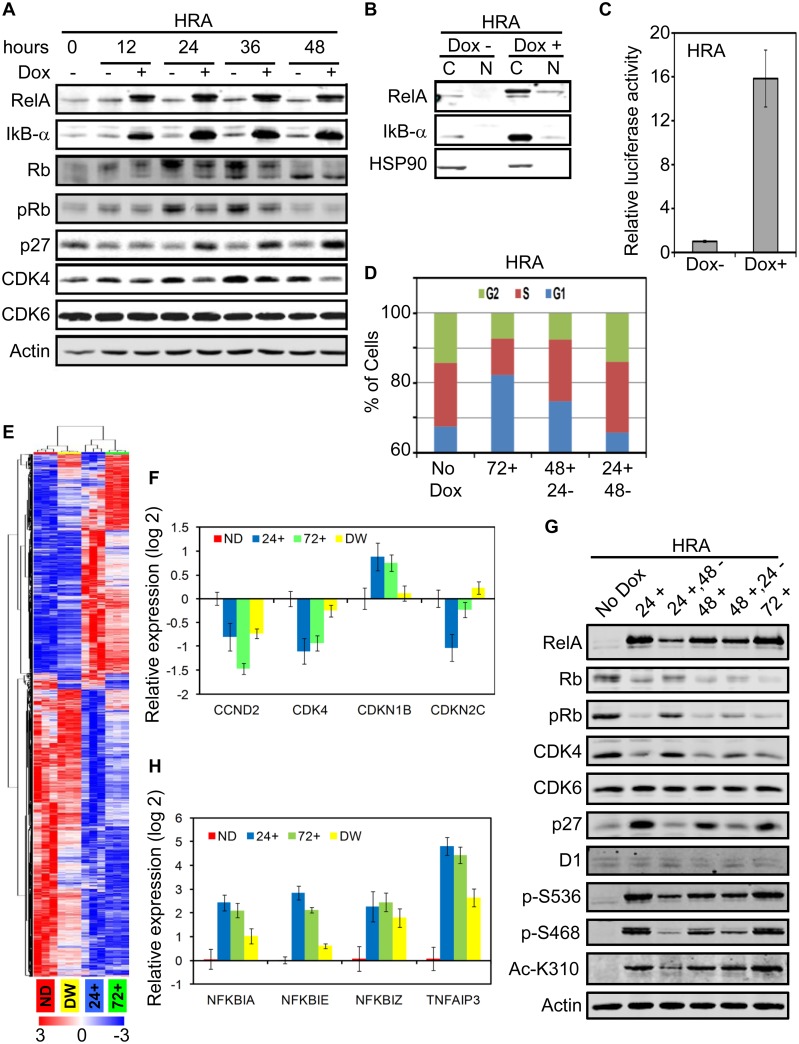
Fig 3. RelA induction down-regulates CDK4 resulting in Rb hypo-phosphorylation and cell cycle arrest.
A. HRA cells were cultured in the presence and absence of Dox (1μg/ml) for 48 hours and changes in indicated proteins was monitored every 12 hours by immunoblot. B. HRA cells were cultured in the presence and absence of Dox (1μg/ml) for 48 hours and cytoplasmic (C) and nuclear (N) proteins were extracted. The samples were analyzed by immunoblot. HSP90 was used as a marker for purity of the nuclear fraction. C. HRA cells were co-transfected with an NF-kB reporter Firefly luciferase and background control Renilla luciferase plasmids. Transfected cells were trypnized, plated in triplicates and cultured in the presence or absence of Dox (1μg/ml) for 48 hours. Subsequently, expression of Firefly and Renilla luciferase was estimated. Activity of Firefly luciferase in the Dox+ and Dox– samples were normalized to the respective activity of Renilla luciferase. Activity values in the Dox+ sample was normalized to the Dox- sample to obtain the bar plot. Increase in Firefly Luciferase activity following RelA induction was statistically significant (p-value: 1.3 E -7). D. HRA cells were cultured in the absence (No Dox) or presence of Dox (1μg/ml) for 72 hours (72+). Parallel HRA cells cultured in the presence of Dox for 48 or 24 hours and then switched to medium devoid of Dox for 24 (48+, 24-) or 48 (24+, 48-) hours were fixed and stained using Propidum Iodite. Distribution of cells in the G2, S and G1 phases of the cell cycle was analyzed using flow cytometry. E. HRA cells were treated according to the scheme in S4A Fig. Total RNA was extracted from the samples and global gene expression levels was determined using the Affymetrix Primeview array. Differentially expressed genes among the four conditions were identified (FDR < 0.05) and hierarchical clustering of the genes and samples was performed using the differentially expressed genes. F. Expression levels of the core G1/S transition genes including cyclins, CDKs and CDK inhibitors in 24+, 72+ and DW samples were normalized to the expression level in the ND samples. The bar plot indicates differentially expressed genes (p-value <0.05, fold change > 2) from the core G1/S transition gene list. G. HRA cells were treated with dox according to the scheme in S4C Fig. Whole cell lysates were analyzed using indicated antibodies, including antibodies specific to phosphorylated (S536 and S468) and acetylated (K310) forms of RelA. H. Differential expression (p-value < 0.05, fold change > 4) of feedback negative regulators of RelA including IkB, CYLD and TNFAIP3 were identified. The bar plot shows expression changes relative to the ND sample.

