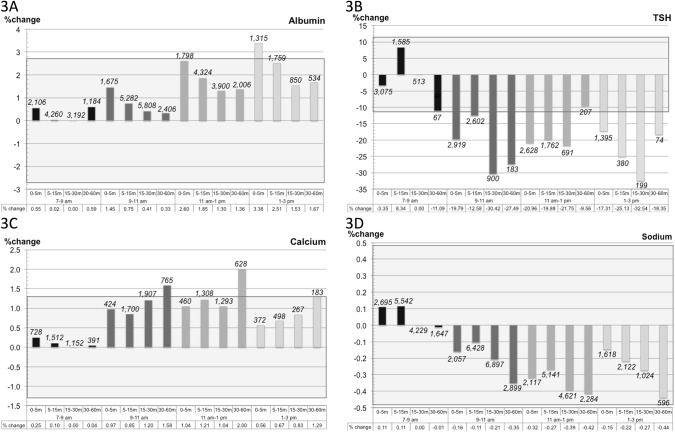
Fig 3. Total impact of resting time and diurnal variation on the biochemical compounds.
The figure shows the change in mean value (in %) relative to the mean under the reference conditions (7–9am, resting time 15–30 minutes) for the four components A) albumin, B) thyrotropin, C) calcium and D) sodium. The shadowed background field indicates the limits for the MAB (1/3×SDpop). The values above the columns are the number of patients in each interval.

