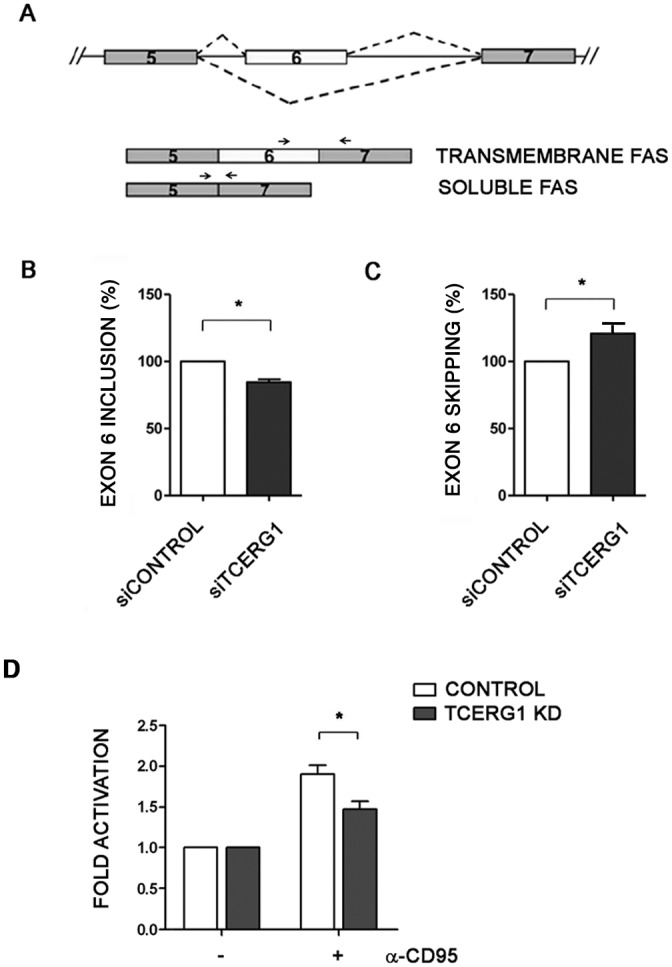
Fig 8. Regulation of Fas alternative splicing by TCERG1.

(A) Schematic representation of the structure of the Fas gene, with exons 5, 6, and 7 (boxes), introns (lines), and alternative splicing events (dotted lines). The alternative Fas isoforms generated by the inclusion or skipping of exon 6 are indicated. The primers used for conventional PCR are shown with black lines and for qPCR as black arrows (B) Analysis of endogenous Fas alternative splicing in control and siTCERG1 HEK293T cells. After total RNA extraction, RT-qPCR was carried out using the primers indicated in the panel (black arrows) to amplify the long transmembrane Fas isoform. The bar graph represents the percentage of exon 6 inclusion (means ± SEM). Data are from four independent experiments. *, p < 0.05. (C) The same experimental procedures described in B were performed using specific primers to amplify the short soluble Fas isoform. Data are from three independent experiments. *, p < 0.05. (D) Analysis of caspase-8 activation in control and TCERG1 knockdown Jurkat cells incubated without (-) or with (+) 50 ng/ml of α-Fas/CD95 for 6 h. Caspase-8 activity was measured by a chemiluminescence assay. The bar graph represents the fold induction of caspase-8 activity under these conditions (means ± SEM). Data are from three independent experiments. *, p < 0.05.
