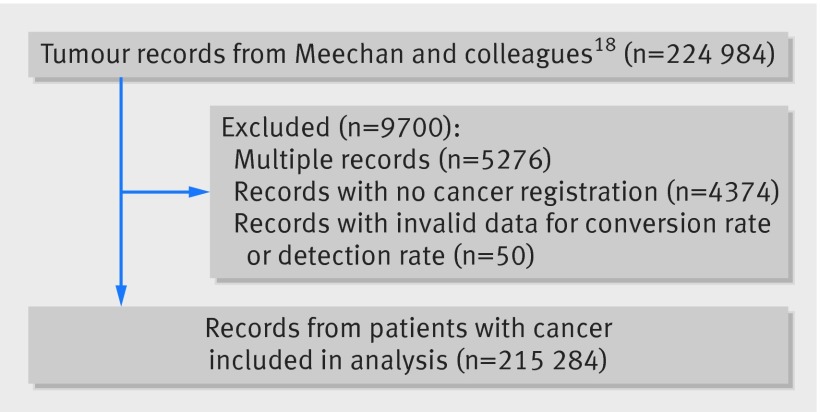
. 2015 Oct 14;351:h5102. doi: 10.1136/bmj.h5102
© Møller et al 2015
This is an Open Access article distributed in accordance with the terms of the Creative Commons Attribution (CC BY 4.0) license, which permits others to distribute, remix, adapt and build upon this work, for commercial use, provided the original work is properly cited. See: http://creativecommons.org/licenses/by/4.0/.

