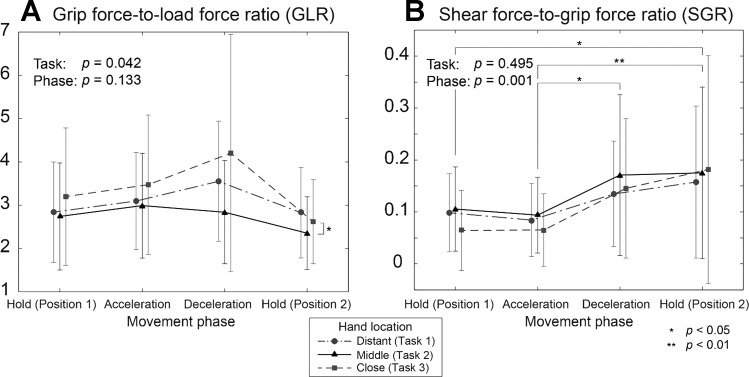
Fig. 3.
Mean (SD) grip force-to-load force ratio (GLR; A) and shear force-to-grip force ratio (SGR; B) for the three tasks. Overall, the GLR values were significantly higher during task 3 (P < 0.001). Specifically, for the second half of the movements (deceleration and hold in position 2), GLR for task 3 (close hand locations) were significantly greater than for task 2 (middle location) (P < 0.05). In contrast, no difference between tasks were found in SGR values (P = 0.930). Overall, the SGR values were significantly higher during the second half of the movement (phases 3 and 4; P = 0.001). Significant differences: *P < 0.05, **P < 0.01.

