Figure 1.
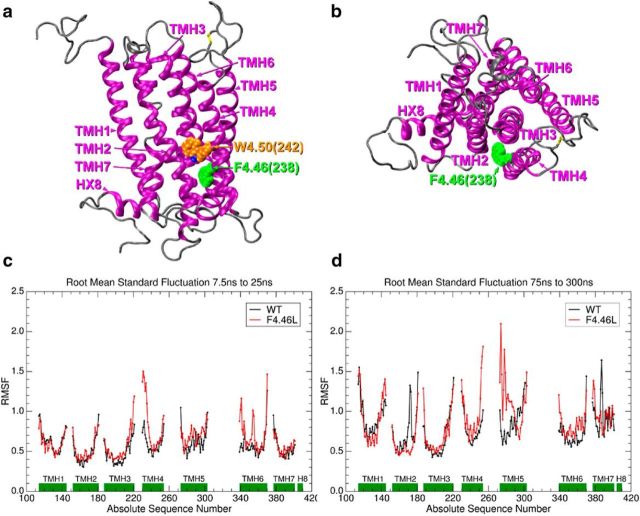
Location of residue 4.46(238) in the CB1R (a, b) and molecular dynamics results for wild-type (WT) and mutant (MT) CB1R (c, d). In a, the transmembrane helix (TMH) bundle is shown in a side view looking from the lipid bilayer toward TMH2/3/4. Here, it is clear that 4.46(238) (green) is located on the lipid face of TMH4, one turn below the highly conserved class A G-protein-coupled receptor residue, W4.50 (orange). In b, the CB1R is shown in an extracellular view, with the location of residue 4.46(238) highlighted in green. Here, it is clear that residue 4.46(238) faces the TMH2–3-4 outside interface. c presents a plot of root mean square fluctuations (RMSF) for the transmembrane portion of rat WT CB1R(black) and the F238L mutant (red) versus residue number for the period before W6.48 undergoes the χ1 g+ → trans conformational change (7.5–25 ns portion of MD trajectory). The green bars identify the residue spans for each TMH. The RMSF values for the F238L mutant (red) are larger than WT (black) in the following regions: the intracellular (IC) ends of TMH3/TMH4 (the IC-2 loop), the IC end of TMH6 (IC-3 loop), as well as the TM portion of TMH6 itself. Similar results were obtained for the second trajectory. This increase in RMSF is an indicator of increased flexibility of these regions in the MT receptor compared with WT. d presents a plot of RMSF for the transmembrane portion of rat WT CB1R (black) and the F238L MT (red) versus residue number for the period after W6.48 returns to a g+ χ1 (75–300 ns portion of MD trajectory). The green bars identify the residue spans for each transmembrane helix. The EC ends of TMH4 and TMH5 (ends of EC-2 loop) of the MT undergoes the largest fluctuation, which is consistent with previous studies showing EC-2 loop movement during GPCR activation (Ahn et al., 2009; Ahuja et al., 2009; Bertalovitz et al., 2010). Similar results were obtained for the second trajectory.

