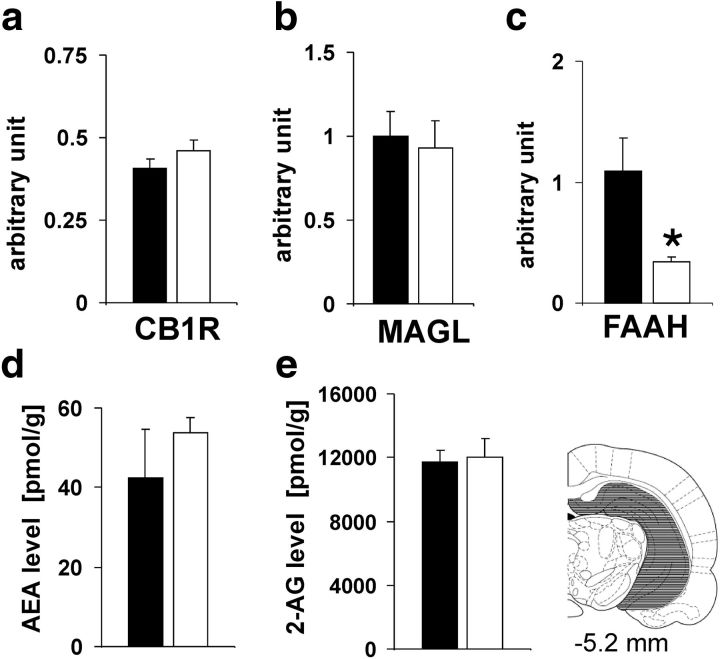
Figure 3.
Expression of CB1R and other components of the eCB system in the hippocampus. CB1R protein levels in the rat hippocampus did not differ between MT animals and WT controls (a) (p = 0.2). Protein levels of MAGL were also unaltered (b) (p = 0.8). As in the striatum, FAAH levels were significantly reduced in MT compared with WT rats (c) (p = 0.03). No significant differences between the genotypes could be found for expression of AEA (d) (p = 0.32) and 2-AG (e) (p = 0.85). Data are indicated as means ± SEM (Western blot analysis: CB1R and MAGL n = 5; FAAH: MT n = 5, WT n = 4; AEA, 2-AG: MT: n = 9, WT n = 14; *p ≤ 0.05).

