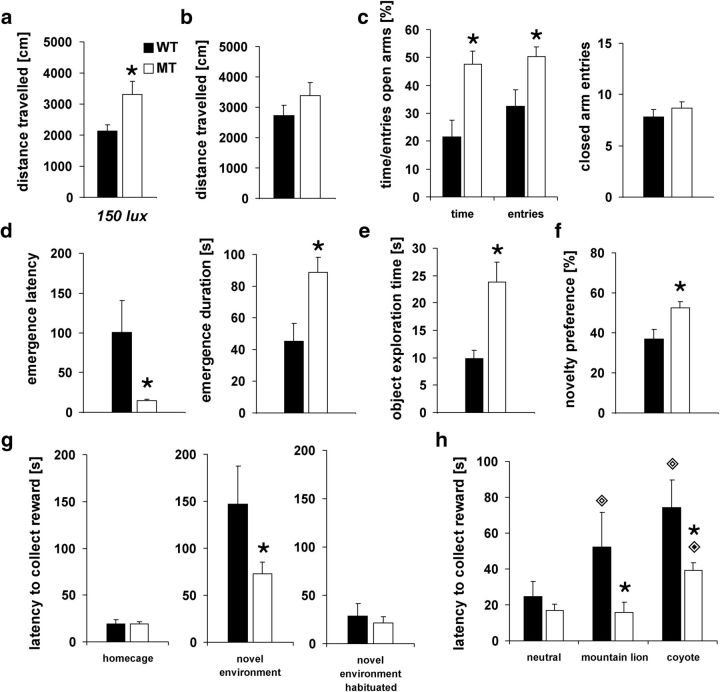
Figure 4.
Novelty-seeking and risk-taking behavior of adult Cnr1 MT and WT animals. MT rats showed a significantly higher activity in the open-field test than WT when tested under high-anxiety conditions (unhabituated testing and a high light intensity of 150 lx; p = 0.026) (a). Only a trend for increased activity between the genotypes was observed when animals were retested in the open field under low anxiety conditions (b) (p = 0.062). MT rats were found to show increased risk-taking behavior in the EPM (% time: p = 0.002; percentage entries: p = 0.011) compared with WT (c), although the acitivity level did not differ between the genotypes (closed arm entries: p = 0.38). In the light/dark emergence test (d), MT rats showed a decreased emergence latency (p = 0.021) and spent more time in the lit compartment (p = 0.008) than WT controls. MT also showed higher novelty-seeking during exploration of a novel object (p = 0.005) (e) and novelty preference testing (p = 0.013) (f). Risk-based decision making was assessed in a PORT. First, the latency to collect a palatable food reward was assessed in various contexts with different degrees of familiarization (g). No genotype differences were found in the latency to collect the pellet within in the home cage (p = 0.98), whereas WT rats showed initially a significant higher latency in reward collection in the test apparatus (p = 0.048), which was not observable anymore after 5 d of habituation to the test environment (p = 0.41). MT and WT rats differed significantly during PORT testing (interaction effect: F(2,32) = 7.72, p = 0.002) (h). Presentation of both predator odors increased reward-collection latency significantly in WT (mountain lion: p < 0.001; coyote: p < 0.001), whereas only the coyote odor affected response latency in MT rats (p < 0.001). Latency did not differ between the genotypes in the control condition (p = 0.57), but was significantly enhanced in WT compared with MT animals for both predator odors (mountain lion: p = 0.01; coyote: p = 0.013). Data are indicated as means ± SEM (open-field, EPM, EMT, novel object exploration, novelty preference: MT n = 13, WT n = 10; PORT: MT: n = 12, WT n = 6; *p ≤ 0.05).

