
Figure 4.
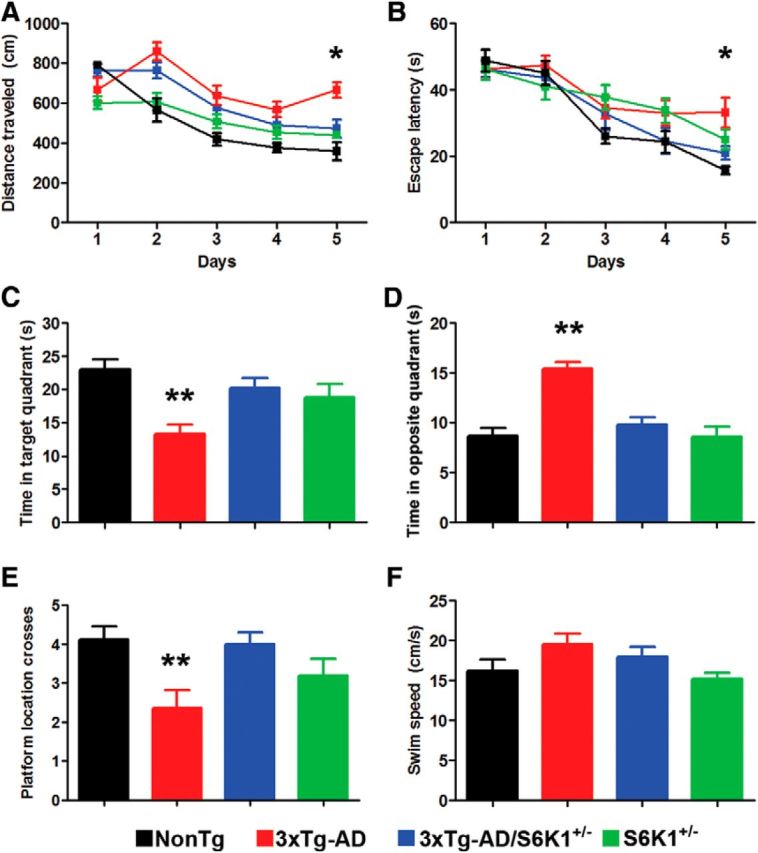
Reducing S6K1 levels improves spatial learning and memory deficits in 3xTg-AD mice. A, B, Learning curves of mice trained in the spatial reference version of the Morris water maze (NonTg, n = 10 mice; S6K1+/−, n = 10 mice; 3xTg-AD, n = 14 mice; 3xTg-AD/S6K1+/−, n = 14 mice). The distance traveled and the escape latency to find the hidden platform was plotted against the days of training. The values for each day represent the average of four training trails. For the distance traveled, we found significant effects for day (p < 0.0001, F(3,43) = 23.81), genotype (p < 0.0001, F(3,43) = 15.99), and genotype × day interaction (p = 0.0018, F(12,172) = 2.74). For the escape latency, we found significant effects for day (p < 0.0001, F(3,43) = 32.19) and genotype (p = 0.008, F(3,43) = 4.01). Post hoc tests indicated that the distance traveled was higher in 3xTg-AD mice compared with NonTg mice on day 2 (p < 0.001, t = 4.38), day 3 (p < 0.01, t = 3.27), day 4 (p < 0.05, t = 2.85), and day 5 (p < 0.001, t = 4.57). However, the 3xTg-AD/S6K1+/− mice performed significantly worse than NonTg mice only on day 2 (p < 0.05, t = 2.91). Further, the distance traveled between 3xTg-AD and 3xTg-AD/S6K1+/− was significantly different on day 5 (p < 0.01, t = 3.20). The escape latency of NonTg mice was significantly different compared with 3xTg-AD mice at day 5 (p < 0.01, t = 3.47). However, 3xTg-AD/S6K1+/− mice performed as well as NonTg mice (day 5: p > 0.05, t = 1.03). Notably, the escape latency and distance traveled was not statistically different between NonTg and S6K1+/− mice. C, Time mice spent in the target quadrant during a single 60 s trial. We found a significant difference among the groups (p = 0.001, F(3,43) = 6.52). Bonferroni's corrected post hoc tests showed that 3xTg-AD mice performed significantly worse when compared with NonTg mice (p < 0.05, t = 4.14). More importantly, the 3xTg-AD/S6K1+/− mice performed significantly better than 3xTg-AD mice (p < 0.05, t = 3.30) and as well as NonTg mice (p > 0.05, t = 2.42). D, Time mice spent in the opposite quadrant during a single 60 s trial. We found a significant difference among the groups (p < 0.0001, F(3,43) = 18.06). Post hoc tests showed that 3xTg-AD mice performed significantly worse when compared with NonTg mice (p < 0.05, t = 5.80). More importantly, the 3xTg-AD/S6K1+/− mice performed significantly better than 3xTg-AD mice (p < 0.05, t = 5.46) and as well as NonTg mice (p > 0.05, t = 0.98). E, Number of platform location crosses during a single 60 s probe trial. We found a significant difference among the groups (p = 0.007, F(3,43) = 4.52). Post hoc tests showed that 3xTg-AD mice performed significantly worse than NonTg mice (p < 0.05, t = 3.01). In contrast, 3xTg-AD/S6K1+/− mice performed significantly better than 3xTg-AD mice (p < 0.05, t = 3.19) and as well as NonTg mice (p > 0.05, t = 0.19). F, Swim speed was similar among the four different groups (p > 0.05, F(3,43) = 2.38). Learning data were analyzed by two-way ANOVA; probe trials were analyzed by one-way ANOVA. Bonferroni's was used for post hoc tests. Asterisk indicates a significant difference between 3xTg-AD and 3xTg-AD/S6K1+/− mice. Error bars represent mean ± SEM.