
Figure 6.
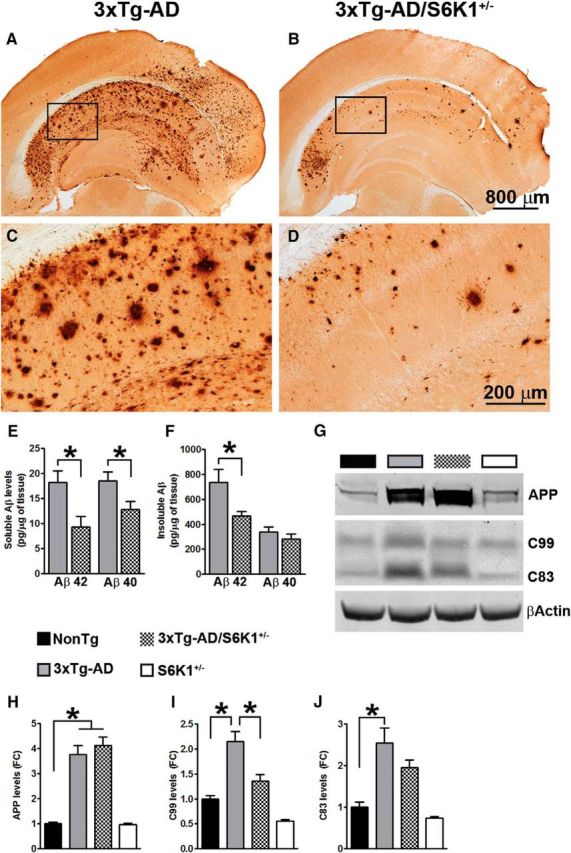
Reduced Aβ pathology in 3xTg-AD/S6K1+/− mice. A–D, Representative microphotographs of brain sections from 3xTg-AD and 3xTg-AD/S6K1+/− mice stained with an anti-Aβ42-specific antibody. C and D are high-magnification images of the boxed areas in A and B, respectively. E, Sandwich ELISA measurements of soluble Aβ42 and Aβ40 levels. The levels of both peptides were significantly lower in mice lacking one copy of the S6K1 gene (Aβ40: t(14) = 2.31, p = 0.03; Aβ42: t(14) = 2.81, p = 0.01; n = 8 mice/genotype). F, Sandwich ELISA measurements of insoluble Aβ42 and Aβ40 levels. While the levels of insoluble Aβ40 were similar between the two groups (t(14) 0.92, p > 0.05), the levels of insoluble Aβ42 were significantly lower in 3xTg-AD/S6K1+/− mice compared with those in 3xTg-AD mice (t(14) = 2.46, p = 0.02; n = 8 mice/genotype). ELISA data were analyzed by Student's t test. G, Representative Western blots of protein extracted from NonTg, 3xTg-AD, 3xTg-AD/S6K1+/−, and S6K1+/− mice. To identify full-length APP, blots were probed with 6E10. To identify C99 and C83, blots were probed with CT20, a C-terminal anti-APP antibody. H–J, Quantitative analyses of the blots obtained by normalizing the quantity of a specific protein with its loading control, β-actin. Data were analyzed by one-way ANOVA followed by a Bonferroni's multiple-comparison test (n = 8 mice/genotype; for APP: p < 0.0001, F(3,28) = 49.05). Post hoc analysis indicated that APP levels were significantly higher in 3xTg-AD and 3xTg-AD/S6K1+/− compared with the other two groups. No differences were observed between 3xTg-AD and 3xTg-AD/S6K1+/− mice and between NonTg and S6K1+/− mice. For C99: p < 0.0001; F(3,28) = 28.44. Post hoc tests indicated that C99 levels were significantly higher in 3xTg-AD mice compared with the other three groups. C99 levels were also higher in 3xTg-AD/S6K1+/− compared with those in S6K1+/− mice. No significant difference was found between NonTg and 3xTg-AD/S6K1+/− mice and between NonTg and S6K1+/− mice. For C83: p < 0.0001, F(3,28) = 15.90. Post hoc tests indicated that C83 levels were significantly higher in 3xTg-AD and 3xTg-AD/S6K1+/− compared with the other two groups. No differences were observed between 3xTg-AD and 3xTg-AD/S6K1+/− mice and between NonTg and S6K1+/− mice. Error bars represent mean ± SEM.