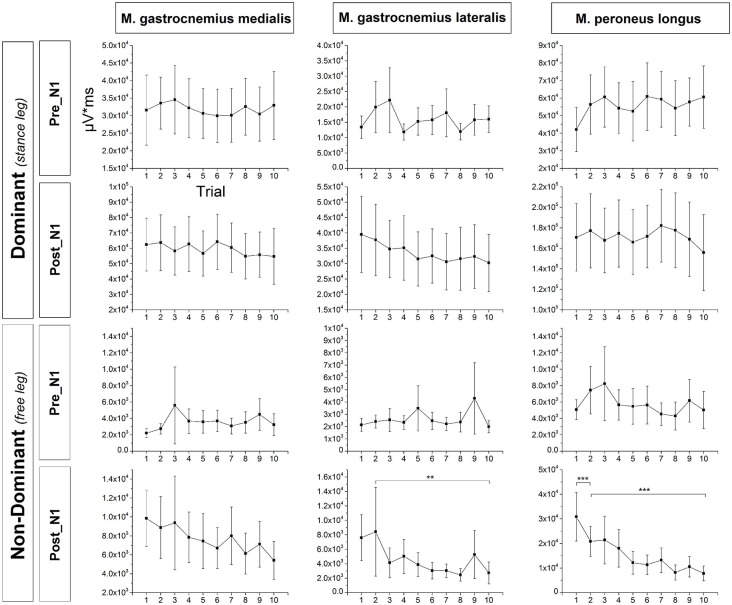
Figure 6.
Mean across subjects integrated EMG activity of the ankle plantarflexors in the time window pre-N1 and post-N1 for each trial. EMG activity of the non-dominant m. gastrocnemius lateralis in the time window post-N1 was significantly larger in T1 compared to T10 but not in T1 compared to T2 indicating longer-term but not initial adaptation. Furthermore, EMG activity of the non-dominant m. peroneus longus in the time window post-N1 was significantly larger in T1 compared to T2 as well as in T2 compared to T10 indicating both initial and longer-term adaptation. Error bars indicate 95% confidence intervals.

