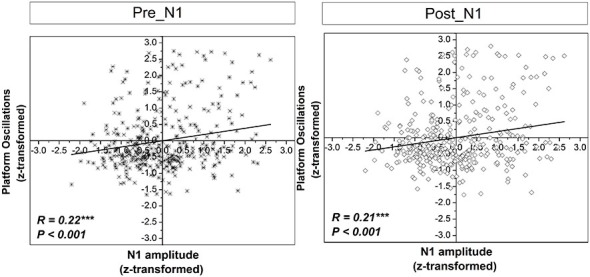
Figure 7.

Correlations between z-scores of the standard normal distribution for the N1 amplitude and platform oscillations (i.e., Euclidean distance) across all subjects and trials in the time window pre-N1 and post-N1. R and p-values indicate correlation coefficients and significance level, respectively.
