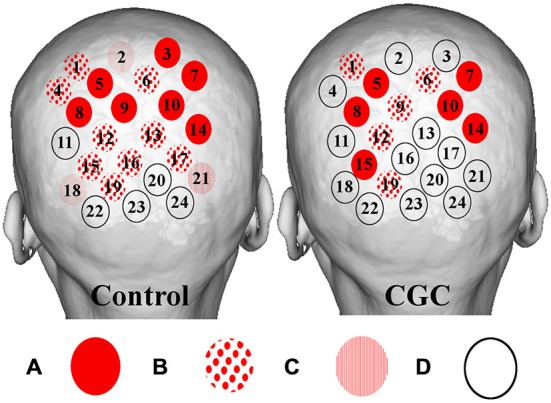
Figure 4.

Figure depicting group averaged (O-P) channel activation for verbal (left) and gaze guidance (right). Magnitude of statistical changes in cortical hemodynamics reflect intensity of brain activation as follows: (A) statistically significant (p < 0.05) increase in HbO2 coupled to statistically significant (p < 0.05) decrease in HHb (red circles); (B) increase HbO2 and decrease HHb with one species reaching statistical significance, p < 0.05 (spots); (C) increase HbO2 and decrease HHb with neither species reaching statistical significance (stripes); and (D) no coupled increase HbO2 and decrease HHb (clear circles). Verbal guidance resulted in a greater number of activating channels (control vs. CGC = 19/24 vs. 11/24).
