FIGURE 2.
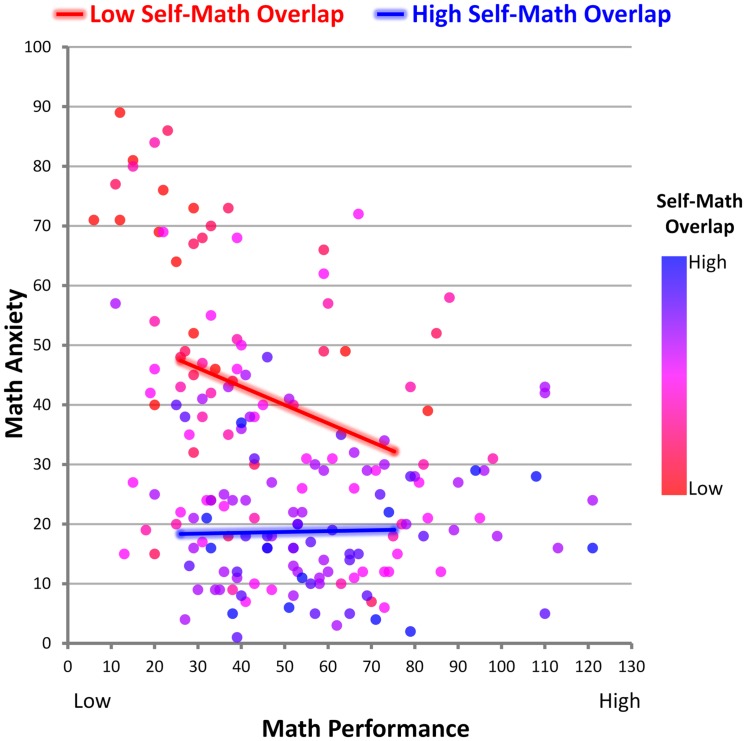
Self-math overlap moderates the association between math performance and math anxiety. Among individuals higher in self-math overlap, the negative association between math performance and math anxiety is ameliorated. Data points are color coded by their level of self-math overlap, where blue indicates high overlap and red indicates low overlap. Note that although redder points (lower self-math overlap) exhibit a negative association between math anxiety (y-axis) and math performance (x-axis), bluer points (higher self-math overlap) exhibit no association. This can also be seen in the overlay figure, which is a line graph based on simple slopes of the data. Among individuals with lower self-math overlap (red line; -1 SD in self-math overlap), those exhibiting lower math performance exhibit higher levels of math anxiety than those exhibiting higher math performance, but among individuals with high self-math overlap (blue line; +1 SD in self-math overlap), there is no significant association between math performance and math anxiety. Lines are drawn from -1 SD to +1 SD in math performance.

