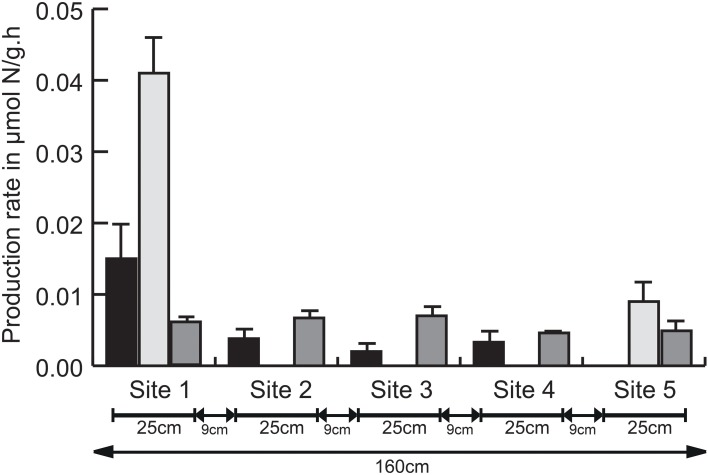
Figure 1.
Averaged nitrite, ammonium, and nitrous oxide production rates (± SD) per sampling site (n = 3) over a period of 5 h (= T1–T5). For clarity, one sided error bars are shown. Black bars: nitrate reduction to nitrite, light gray bars: dissimilatory nitrate reduction to ammonium (DNRA), dark gray bars: denitrification. Total distance between all five sampling sites (1.60 m) and individual distance between all sampling sites is represented. Detailed information on the physico-chemical composition of these five sites is found in Table S3.

