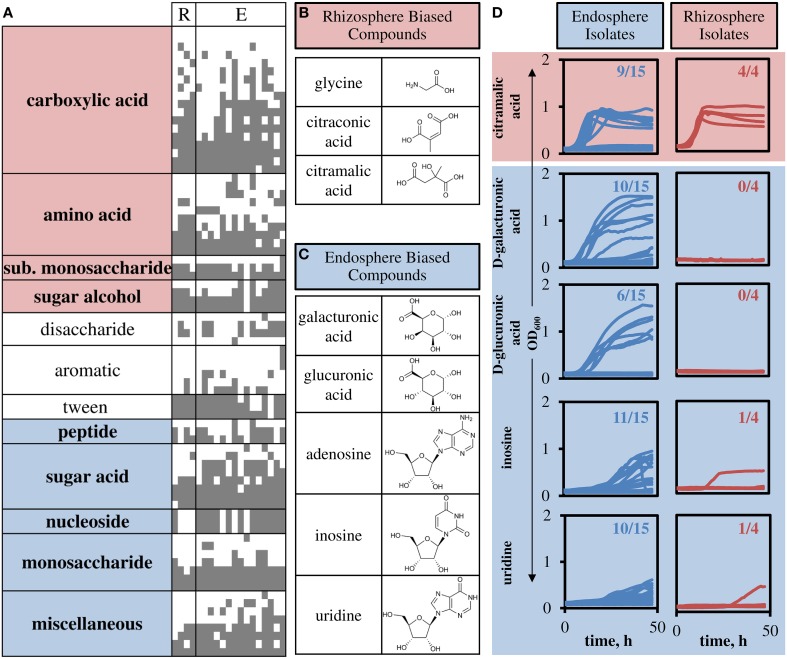
Figure 5.
Compound groups and individual substrates that differentiate endosphere and rhizosphere isolates. (A) Carbon sources are listed vertically (compound group shown), and strains are listed horizontally (R, rhizosphere strains; E, endosphere strains). A gray square indicates metabolic activity in the presence of the substrate. Only differentially used substrates are shown, full table with specific compounds is included in Supplemental File. Highlighting on compound groups indicates significant bias toward rhizosphere (red) or endosphere (blue) isolates. (B) Three compounds that showed highest rhizosphere bias. (C) Five compounds that showed highest endosphere bias. (D) Growth curves for sole carbon sources with observed growth in M9 minimal media. Numbers represent the number of isolates that were shown to grow using the specified compound as the sole carbon source.

