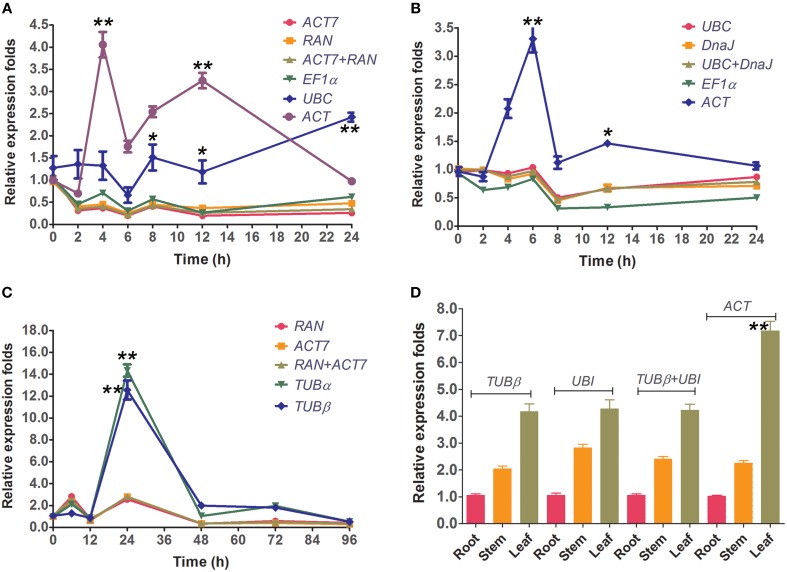
Figure 4.
Relative quantification of CcWRKY15 expression using the validated reference gene(s). The results are represented as mean fold changes in relative expression when compared to the first sampling stage (0 h). cDNA samples were taken from the same subset used for gene expression stability analysis. (A,B) Leaves were collected from 3-week-old seedlings subjected to salt- and PEG-stress after 0, 2, 4, 6, 8, 12, and 24 h of treatment. (C) Leaves were collected from 3-week-old seedlings subjected to biotic stress (C. siamense) after 0, 6, 12, 24, 48, 72, and 96 h of treatment. (D) Different tissue types were collected from 3-week-old seedlings. * indicates statistically significant (p < 0.05); ** indicates greatly statistically significant (p < 0.01).

