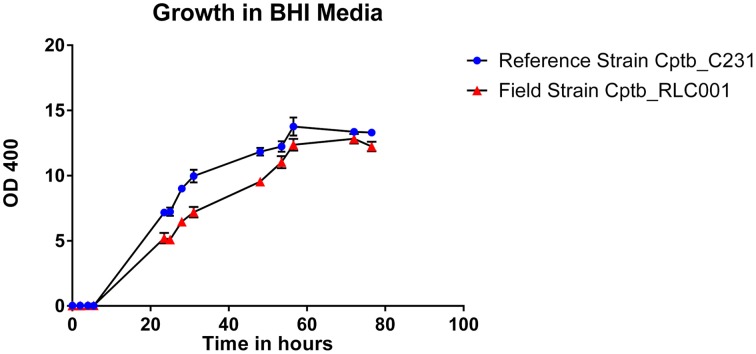
Figure 1.
Graph demonstrating growth rates in BHI liquid media of a reference strain of C. pseudotuberculosis Cptb_C231 (blue circles) compared to that of the field isolate C. pseudotuberculosis Cptb_RLC001 (red triangles). The chart plots relative cell density in liquid media, as measured by optical density (OD 400), against time in hours. Mean values plotted with error bars representing standard error of the mean. This is a representative growth curve with identical features seen in other field strains.

