
Figure 2.
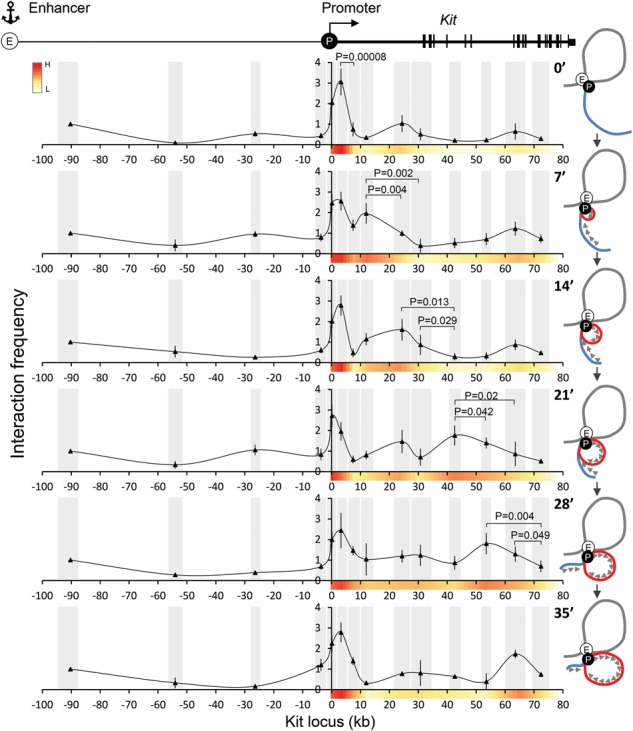
Contacts formed by the Kit −114 enhancer during synchronized transcriptional elongation. (Top) Map of the Kit locus. 3C experiments at the indicated time points using the −114 enhancer as an anchor region. Interaction frequencies were normalized to the intervening region at −93. Gray bars annotate the analyzed BglII fragments, the X-axis indicates genomic distances (in kilobases) from the start site, and the Y-axis indicates interaction frequency. n = 5. Error bars indicate standard deviations. Cartoons at the right illustrate the dynamic architecture compatible with the 3C measurements. (E) Enhancer; (P) promoter; (red line) dynamic loop extrusion during elongation.