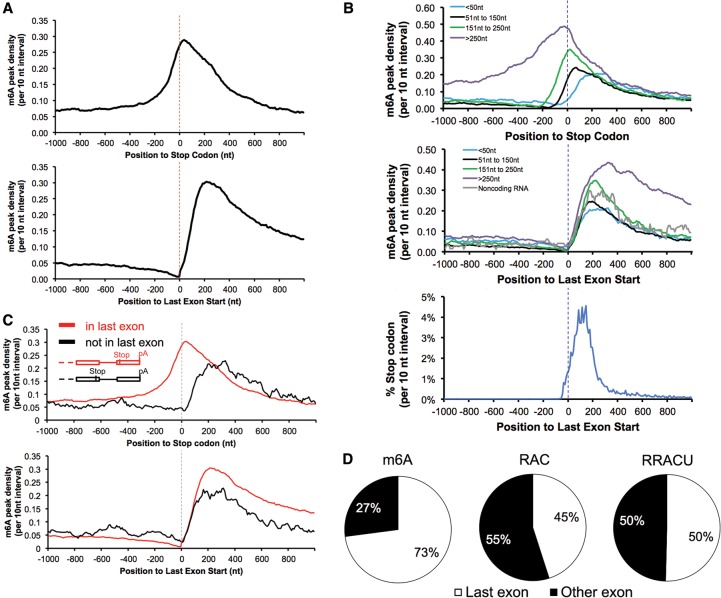
Figure 2.
m6A is enriched when entering last exons but not at stop codons. (A) Entering the last exon, m6A density increased sharply (bottom panel) in contrast to its lagging increase when approaching the stop codon (top panel). Data are from mouse brains. “m6A peak density” was calculated as the number of m6A peak regions in a 10-nt interval divided by the total number of mRNAs that contained this position. (B) m6A is enriched in the last exons but not around the stop codons. The top panel is the m6A peak distribution in the region around the stop codons; the two bottom panels are the distribution of the m6A peak regions and stop codons around the last exon start. mRNAs were grouped according to their stop codon locations to the last exon start. (C) m6A is enriched in the last exons but not around the stop codon when the stop codon is not in the last exon. (Top and bottom panels) mRNA with noncoding last exons anchored at the last exon start or the stop codon. (D) Most exonic m6As locate in last exon (mouse brains). The three pie graphs show the relative proportions of m6A peaks and the RAC and RRACU motifs in the last exon and other exons, with 100% representing all m6A peaks and RAC and RRACU sequences in mRNA. See also Supplemental Figure 3 for human and previously published data.

