
Figure 3.
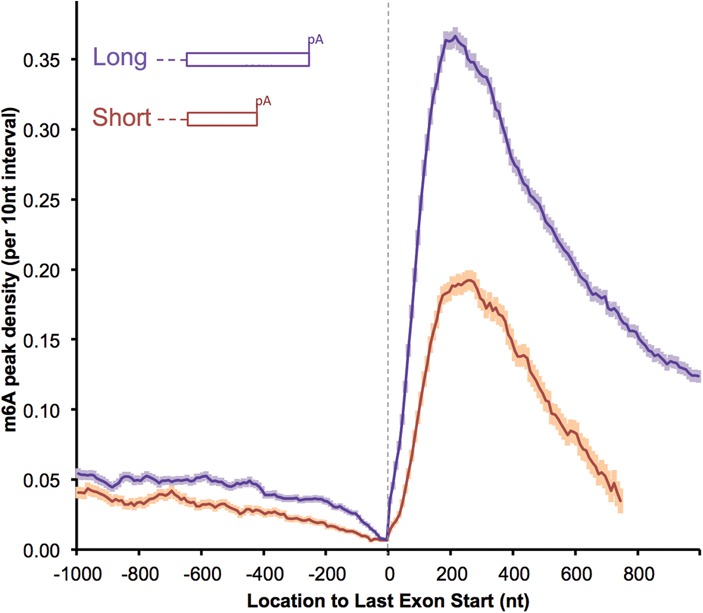
Short last exons have a lower m6A density (mouse brains). The m6A density in the last exons were compared between longer and shorter last exons (long: >850 nt, 5916 genes; short: ≤850 nt, 3624 genes). All of the genes considered are multiexon-coding genes with RPKM (reads per kilobase per million mapped reads) ≥ 1 in the mouse brain. The results showing more proximal m6A in transcripts using distal polyA sites are normalized to transcript abundance: “m6A peak density” was calculated as the number of m6A peak regions in a 10-nt interval divided by the total number of mRNAs that contained this position (the same definition is used throughout the text). The error bar indicates the standard error of the mean at each position. See also Supplemental Figure 4 for human data and RAC motif controls.