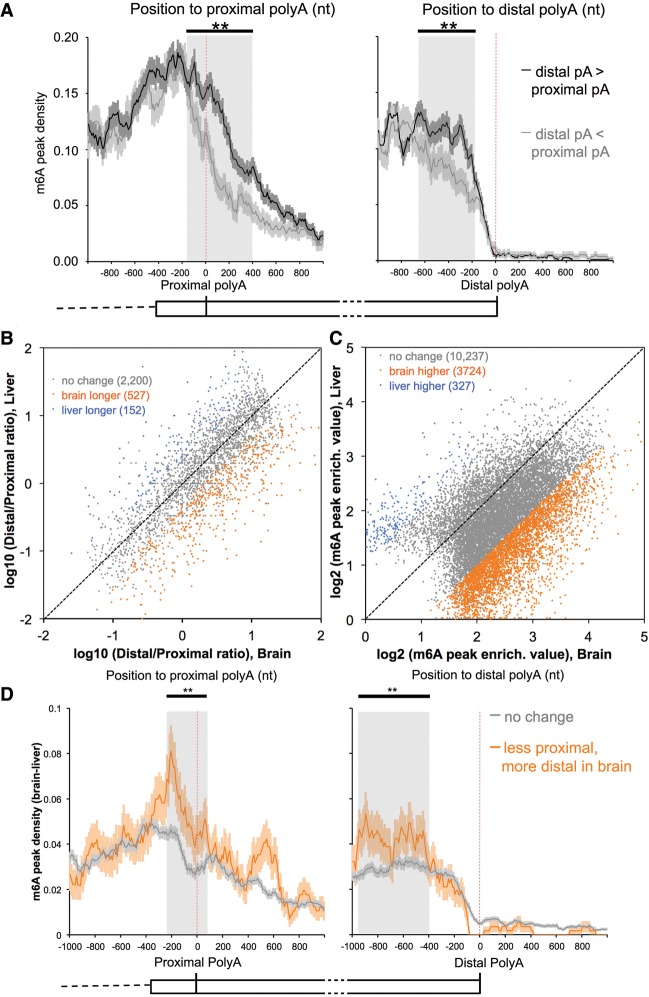
Figure 4.
Higher m6A levels in the last exons correlates with more distal polyA site usage. (A) m6A is more abundant near proximal sites that are used less frequently (black line; left panel); when distal sites are used more, the m6A level is higher until the polyA site is reached (black line; right panel). The error bar indicates the standard error of the mean at each position. The shaded area highlights the major area of difference between two groups. (**) P < 10−35, Fisher's exact test. “Used more“ means ≥60% usage of all polyA sites in the last exon, and “used less” means ≤40% usage. Other cutoffs, including 50% or 70%, produce the same findings. The expression of mRNAs in regions between proximal and distal polyA sites is adequate for m6A detection (RPKM ≥ 1). Mouse brain data are presented here; see also Supplemental Figure 5A for human data. (B) Distal APA sites in the last exons are used more often in brains for coexpressed mRNAs. APA site pairs with statistically significant differences in usage are highlighted in orange (higher usage of distal sites in the brain) or blue (higher usage of distal sites in the liver). FDR = 20%, Fisher's exact test. The same conclusion is true for FDR = 5% (Supplemental Fig. 5B). (C) m6A peak regions in the last exons have a higher enrichment value in the brain. “m6A peak enrich. value” is the m6A-IP reads normalized to the input reads for each m6A peak region. m6A peak regions with statistically significant differences in “m6A peak enrich. value” are highlighted in orange (higher in the brain) or blue (higher in the liver). FDR = 5%, Fisher's exact test. (D) Positional plot of m6A peaks around APA sites in the last exons. “m6A peak density (brain–liver)” for each position was calculated as the number of m6A peak regions that are significantly higher in the brain (orange points in C) in a 10-nt interval divided by the total number of mRNAs that contained this position. (Orange lines) More distal usage; (gray lines) no change in the brain. The expression of mRNAs in regions between the proximal and distal polyA sites is adequate for m6A detection in both tissues (RPKM ≥ 1). The error bar indicates the standard error of the mean. The shaded area highlights the major area of difference between two groups. (**) P < 10−20, Fisher's exact test.

