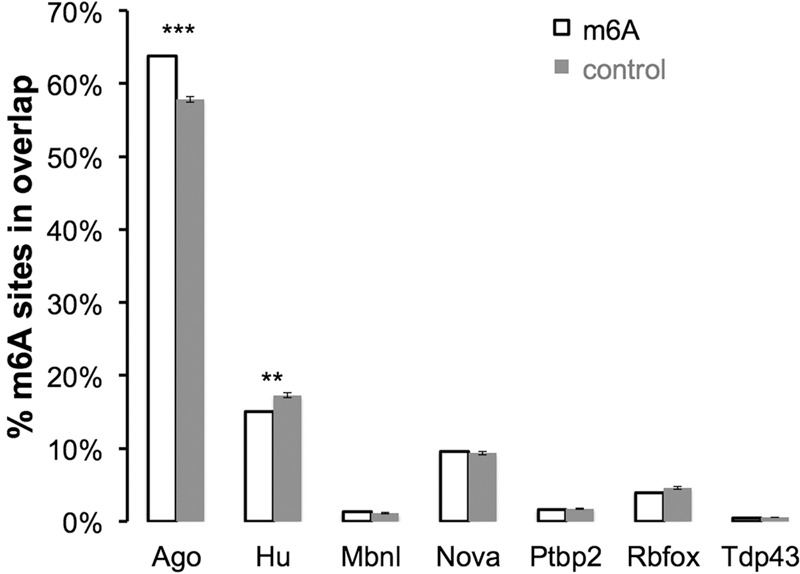
Figure 6.

Overlap of m6A and Ago-binding sites in 3′ UTRs of mouse brains. (% m6A sites in overlap) The percentage of m6A sites (±200-nt flank) overlapped with the RNA-binding protein-binding site in mouse brains (mapped by published HITS-CLIP data) (see the Materials and Methods for reference details). The control was the randomly picked RAC motif (±200-nt flank) in the same 3′ UTR as m6A. Ten independent controls were performed to estimate the statistics. The error bar indicates the standard error of the mean. (***) P < 10−50; (**) P < 10−10, one sample t-test.
