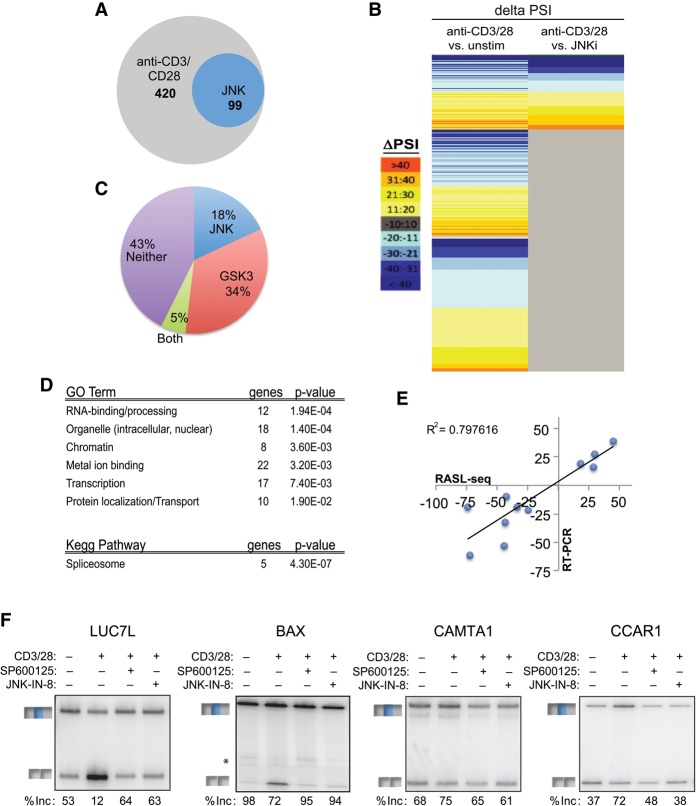
Figure 6.
JNK signaling mediates a network of TCR-induced alternative splicing in primary T cells. (A,B) Venn diagram (A) and heat map (B) of total significant alternative splicing events induced by anti-CD3/CD28 (48 h) and those dependent on JNK. Anti-CD3/CD28 sensitivity and JNK dependence are as defined in the text. The color scale for the heat map is at the left. See also Supplemental Table S3. (C) Pie chart comparing JNK-dependent versus GSK3-sensitive anti-CD3/CD28-induced events. See also Supplemental Table S3. (D) Gene ontology (GO) terms and KEGG (Kyoto Encyclopedia of Genes and Genomes) pathways enriched (P-value < 0.05) in significant JNK-dependent alternative splicing events as determined by DAVID analysis. (E) Scatter plot comparing RASL-seq-calculated changes in isoform expression versus those determined by RT–PCR. (F) Representative RT–PCR gel of RASL-seq-identified JNK-dependent alternative splicing events upon inhibition of JNK with either SP600125 or IN-8. Percent inclusion (% inc) is the average of three independent experiments. See also Supplemental Figure S7.

