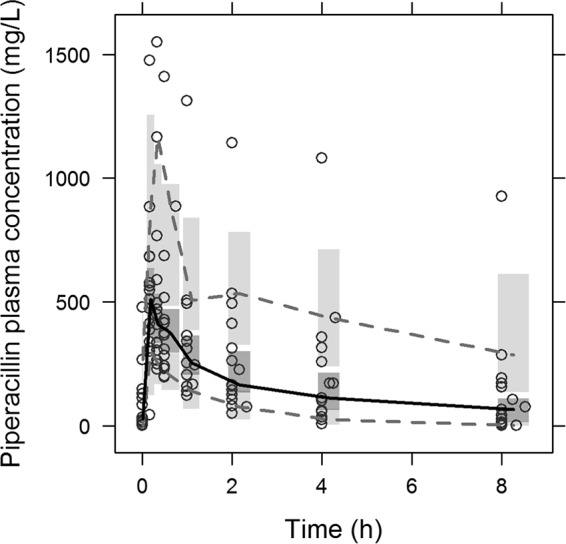
FIG 1.

Visual predictive check (VPC) of final PK model based on 1,000 simulations. Open circles, observations; solid black line, median interpolated observations; gray dashed lines, 10th and 90th percentiles of observations. Shaded areas are the 90% model prediction interval of the median (dark) and the 10th and 90th percentiles (light).
