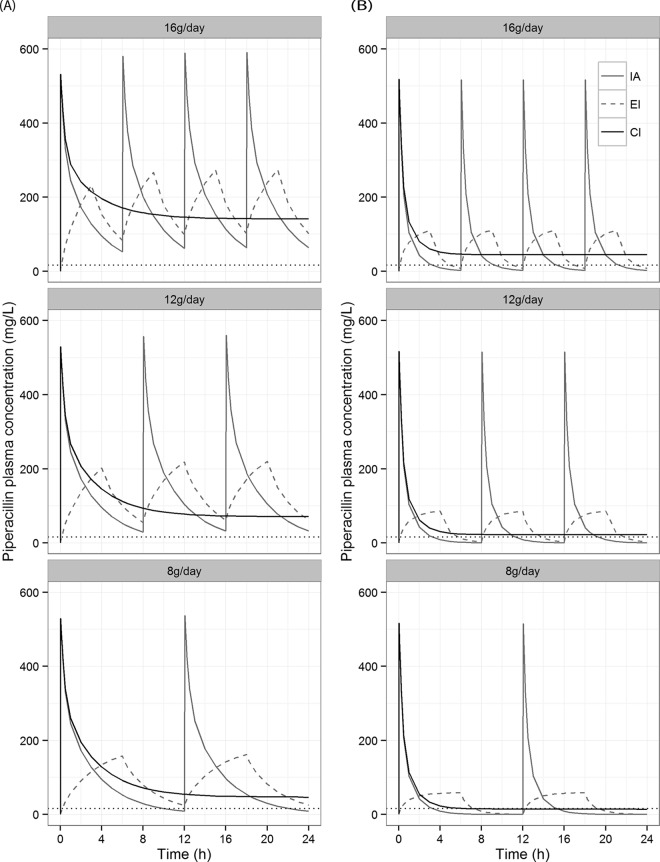
FIG 2.
Illustrations of 24-h piperacillin pharmacokinetic profiles following intermittent bolus administration (IA), extended infusion (EI), and continuous infusion (CI) at 16 g/day, 12 g/day, and 8 g/day. Each profile is predicted from the PK model presented in Fig. 1. (A) Predictions for an average patient in the population; (B) prediction for a patient with PK parameters equivalent to the patient with the lowest PK profile in the population. The dotted line represents a MIC of 16 mg/liter.

