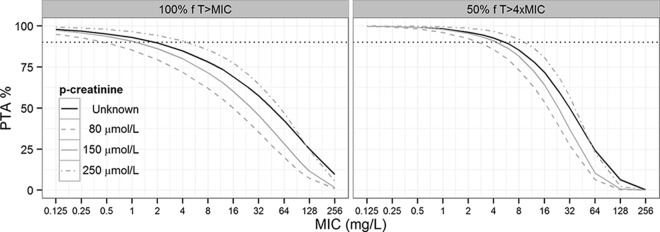
FIG 4.

Probability of target attainment (PTA) versus MIC for different estimates of p-creatinine level, each derived from 1,000 simulations of data (the third consecutive dose of intermittent bolus dosing of 4 g q8h). The black lines demonstrate PTA when patient p-creatinine level is unknown but within the range observed in this population (53 to 446 μmol/liter). The gray lines demonstrate PTA in three scenarios where patient p-creatinine level is known (80, 150, and 250 μmol/liter). The dotted black lines represent a PTA of 90%.
