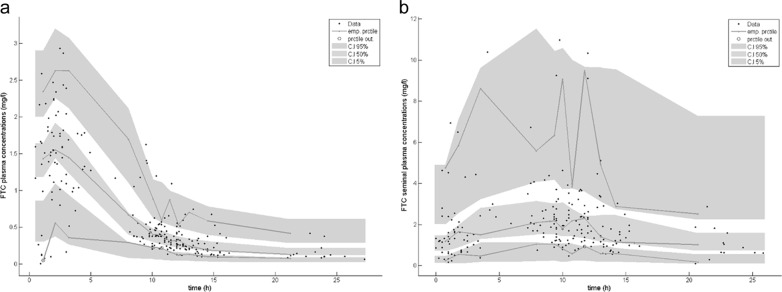
FIG 2.

Evaluation of the final model by visual predictive check (VPC). We performed a comparison between the 5th, 50th, and 95th percentiles (prctile) of observed data (lines), the 90% confidence interval of simulated percentiles (areas), and the observed data (circles) for FTC blood plasma concentrations (a) and FTC seminal plasma concentrations (b).
