
FIGURE 3.
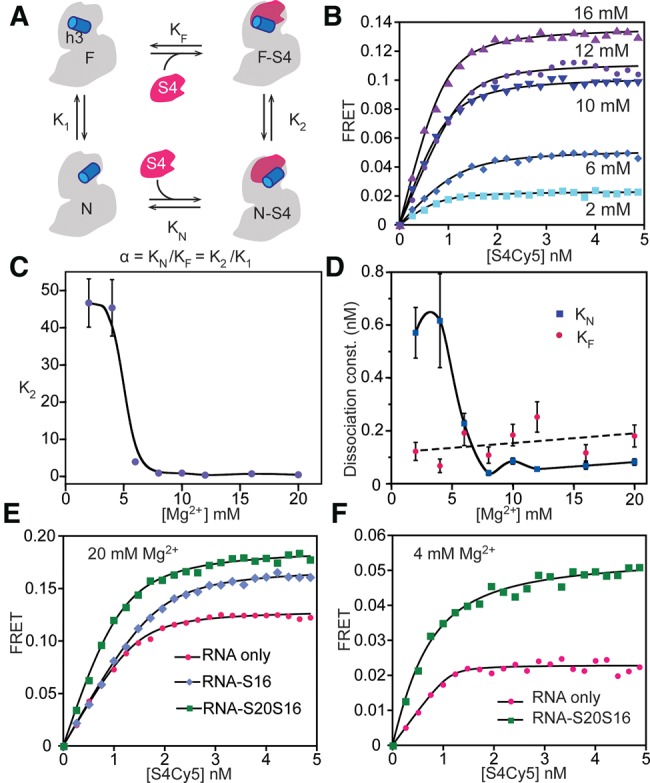
Thermodynamic cycle for S4 binding. (A) Four-state model for S4 titrations contains high-FRET native (N-S4) and low-FRET intermediate (F-S4) S4-bound complexes and corresponding unbound states (N and F). (B) Titrations with S4-Cy5 at different [Mg2+]. Lines represent the best least-squares fit to Equation 1. The initial slope is sensitive to β = KN(1 + K1). The endpoints are proportional to (EN + EF K2)/(1 + K2). See Supplemental Material for further details. (C) Ratio of N-S4 and F-S4 complexes, K2, as a function of [Mg2+]. The smooth curve is only intended to guide the eye. (D) Equilibrium dissociation constant for the native complex (KN, blue diamonds), using K1 from hydroxyl radical footprinting of free 5′-domain RNA. The calculated dissociation constant for the flipped complex (KF, red circles) does not increase with Mg2+. (E) S4-5′-domain complexes give higher FRET signal in 20 mM MgCl2 in the presence of both proteins S16 and S20 (green squares) compared to only S16 (blue diamonds) or without any additional protein (pink circles). (F) Titration curves in 4 mM [Mg2+]. S4-RNA complexes formed in the presence of proteins S20 and S16 (green) show high FRET compared to S4 alone (pink).