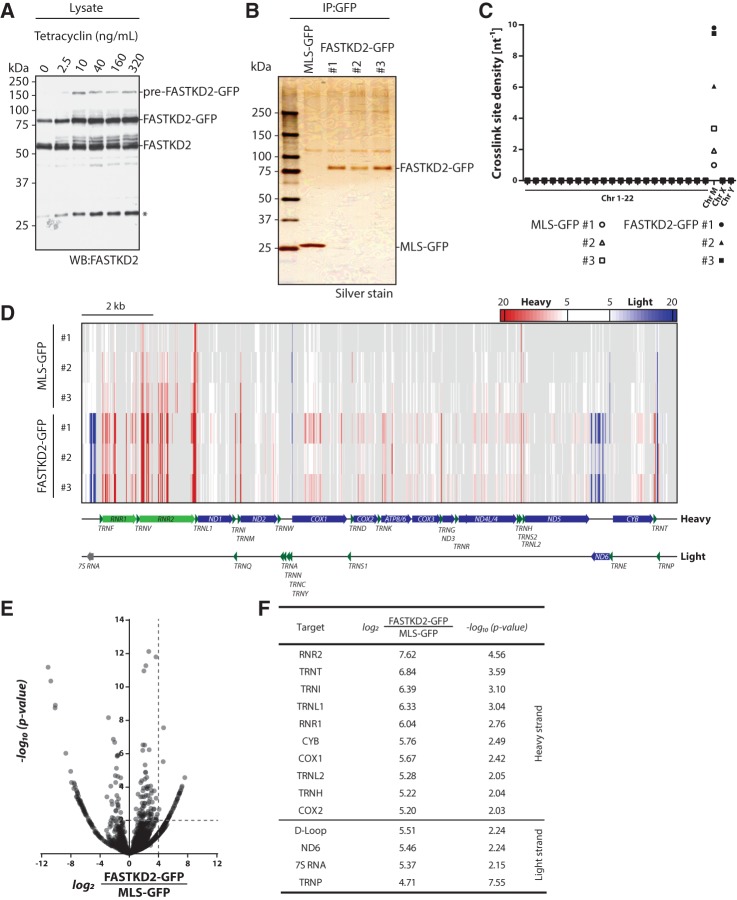
FIGURE 2.
Identification of FASTKD2 interacting transcripts in HEK293 cells. (A) Titration of tetracycline concentrations required for equal expression of endogenous FASTKD2 and FASTKD2-GFP. The asterisk denotes a lower molecular mass species of unknown identity. (B) Analysis of FASTKD2-GFP immunoprecipitates by polyacrylamide gel electrophoresis and silver stain. (C) Crosslink site density plot for iCLIP cDNA libraries after alignment to the human genome and random barcode evaluation. Crosslink site density was calculated using the sum of annotated gene lengths for each chromosome. (D) Heat map representing significant (false discovery rate <0.05) RNA crosslink sites in MLS-GFP and FASTKD2-GFP libraries. Enrichment of light-strand transcripts is indicated in blue, enrichment of heavy-strand transcripts is indicated in red. (E) Enrichment plots for heavy- and light-strand FASTKD2-GFP crosslink sites. Enrichment and P-values were calculated using DESeq2. (F) High-confidence FASTKD2 RNA targets (log2-fold enrichment ≥4, −log10 P-value ≥ 2). Note that for a given target only the parameters for the highest scoring crosslink site are specified.

