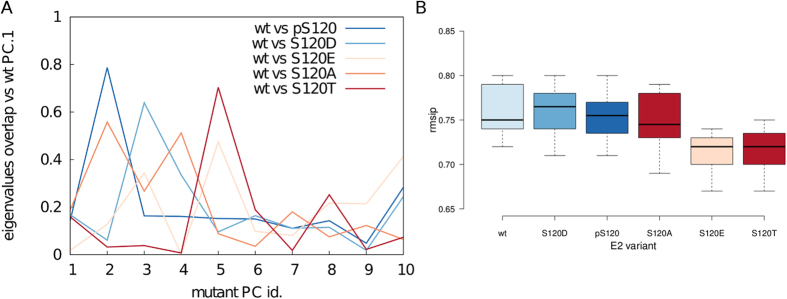
Figure 3. PCA analysis of MD trajectories of wild type, mutant or phosphorylated E2 variants.

(A) We evaluate if there is a crossing-over of eigenvalues between difference PCs of wild type and mutant E2 variants. The example of the overlap between the eigenvalues of the PC.1 of wild type hHR6A and the eigenvalues of each of the first 10 PCs of hHR6A mutants is shown to illustrate this result. We noticed that an interchange of PCs between wild type and mutant variants and this occurs independently of the effect that the mutation has on E2 Ub-activity. Indeed, it is equally true for active and inactive mutant variants. (B) To properly compare our different simulations we estimate the RMSIP between the essential subspaces described by the first 20 PCs of wild-type variants compared each other or compared to S120D, pS120, S120A, S120T and S120E mutant variants respectively. A boxplot analysis of the data has been carried out with BoxPlotR101. Each dataset is coloured according to the effects on Ub-conjugating activity (different shade of blue for active variants and different shade of orange for partially active or inactive variants). Center lines show the medians, box limit indicates the 25th and 75th percentiles and whiskers extend 1.5 times the interquartile range from the 25th and 75th percentiles.
