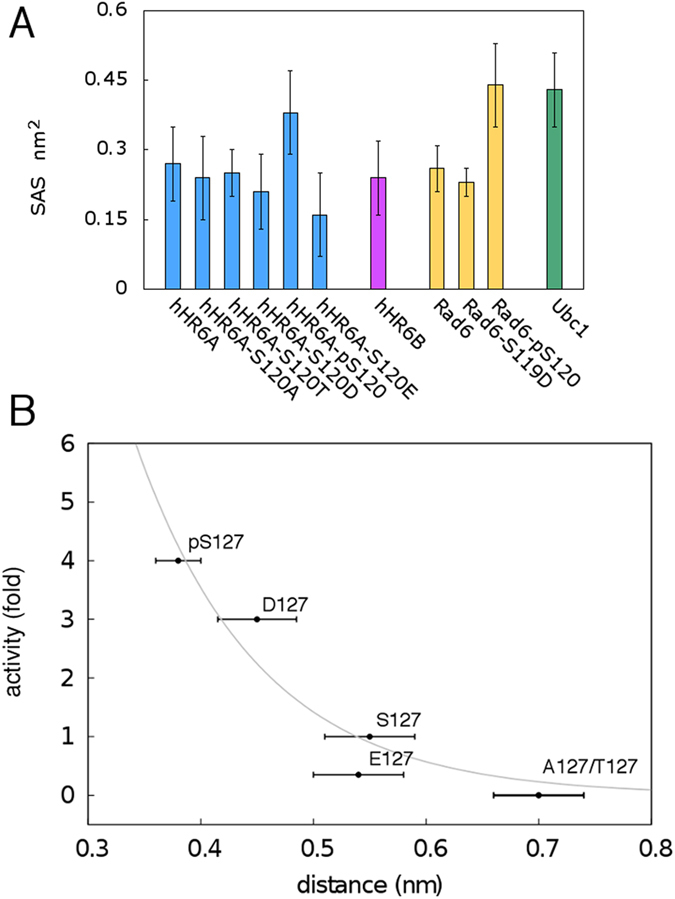
Figure 4.

(A) Average Solvent Accessible Surface (SAS) of the side chain of the E2 catalytic cysteine in the simulations of the wild type, mutant or phosphorylated E2 variants. The SAS (nm2) of the side-chain atoms of the catalytic cysteine is reported as an average value over four replicates of each variants and the corresponding bars indicate the associated standard deviations. hHR6A, hHR6B, Rad6 and Ubc1 variants are shown in blue, magenta, yellow and dark green, respectively. (B) Correlation between the Ub-conjugating activity and the distance between the catalytic cysteine of the E2 donor and the side chain of the substrate acceptor lysine in wild type, mutant and phosphorylated Ube2I-RanGAP1 complexes. The experimental data are taken from29. Each point represents the average distance calculated over four replicates of each variant and the corresponding bars indicate the associated standard deviations. The plot has been derived upon exponential fitting of the data according to f(x) = e−(x*c) * b with fit parameters b and c set equal to 136.28 and 9.12, which provide a correlation of 0.98.
